

Microbiome gut community structure and functionality are associated with symptom severity in non-responsive celiac disease patients undergoing a gluten-free diet
- PMID: 40476734
- PMCID: PMC12282095
- DOI: 10.1128/msystems.00143-25
Microbiome gut community structure and functionality are associated with symptom severity in non-responsive celiac disease patients undergoing a gluten-free diet
Abstract
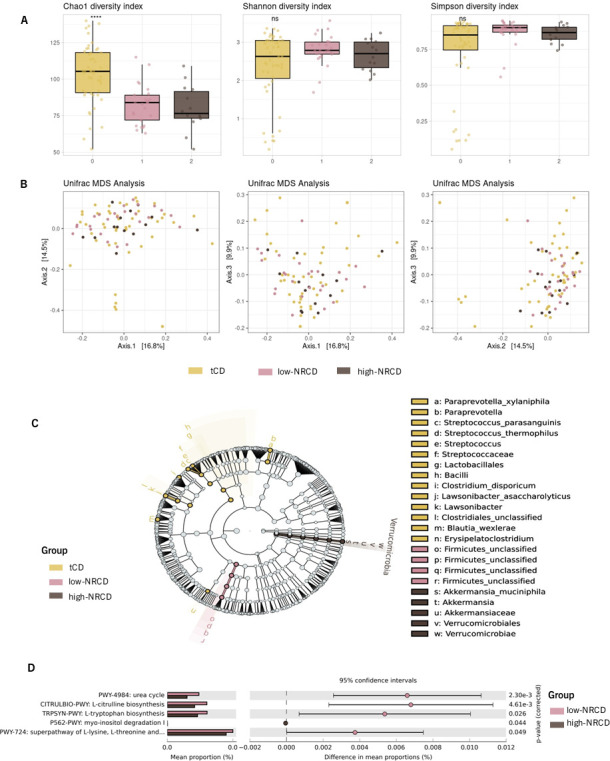
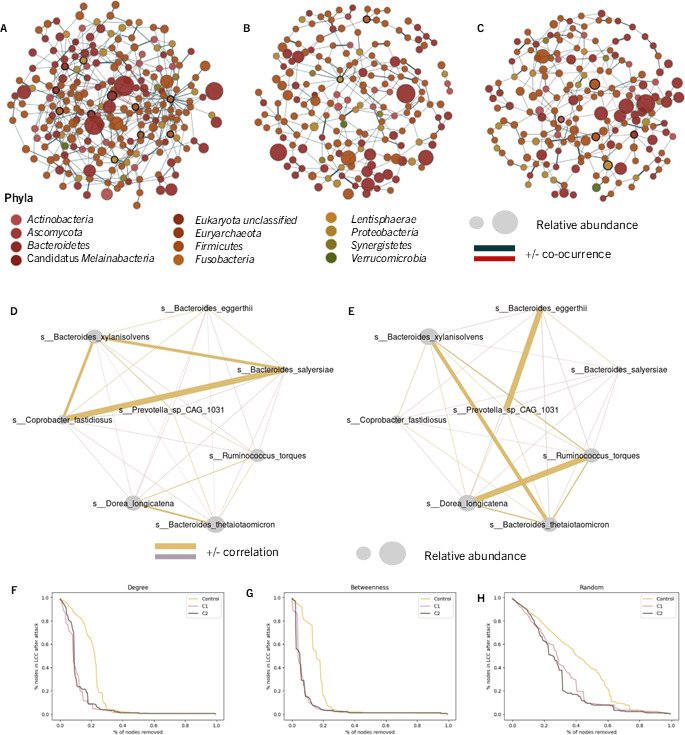
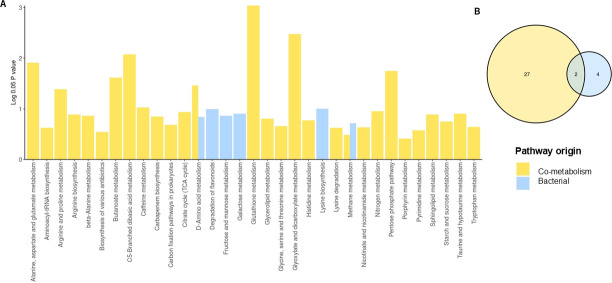
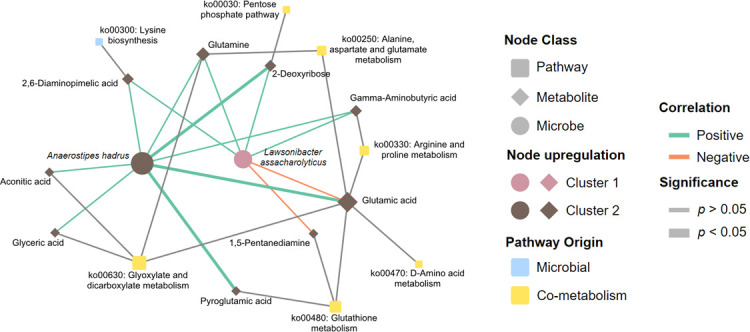
Non-responsive celiac disease (NRCD) challenges clinicians due to persistent symptoms despite a gluten-free diet (GFD). We present a cross-sectional pilot study including 39 NRCD patients to describe the underlying mechanisms contributing to symptom persistence by integrating different levels of data (fecal shotgun metagenomics, mucosal integrity markers, and metabolomic profiles) and using microbial networks to unravel the community structure of the patient's microbiome. Two distinct clusters of patients were identified based on clinical and demographic variables not influenced by gluten consumption. Cluster 1, labeled "Low-grade symptoms," displayed milder symptoms and lower inflammatory markers and a fragmented microbial network characterized by high modularity and a reliance on localized hubs, suggesting a microbial community under stress but capable of maintaining limited functionality. Cluster 2, named "High-grade symptoms," exhibited more severe symptoms, elevated inflammatory markers, and a more connected but antagonistic microbial network with a greater number of keystone taxa, including taxa associated with Th17 activation and inflammation. In contrast, the control network, representing asymptomatic treated celiac disease (tCD) patients, was highly interconnected, resilient, and cooperative, with a robust structure maintained even under simulated disruptions. Metabolomic analysis revealed differential metabolites between clusters, particularly those involved in amino acid metabolism pathways and microbial-derived metabolites such as indolelactic acid and mannitol, which were associated with symptom severity. This study identifies NRCD subgroups based on the gut microbiome and metabolic signatures associated with clinical manifestations, highlighting variations in microbial network stability and metabolite profiles as contributors to symptom persistence and potential therapeutic targets.
Importance: Celiac disease (CD) is a chronic immune-mediated systemic disorder caused by consuming gluten in genetically susceptible individuals. There is currently no cure for CD, and the most effective treatment is maintaining a strict, lifelong gluten-free diet (GFD). This nutritional therapy aims to prevent the immune reaction triggered by gluten and promote the healing of the intestinal lining, resolving the clinical, serological, and histological abnormalities within 6-12 months. However, up to 30% of patients may continue to experience symptoms or exhibit laboratory abnormalities or intestinal inflammation suggestive of active CD, despite following a GFD. This challenge, which encompasses various diagnoses, is known as nonresponsive celiac disease (NRCD). In this study, we explored the role of intestinal microbiota in causing NRCD, finding an association between the persistence of symptoms and changes in mucosal integrity biomarkers, with different gut microbiome structures among NRCD patients, indicating a significant role of the microbiome in NRCD.
Keywords: celiac disease; co-occurrence networks; gluten-free diet; metabolome; microbiome; symptom association.
Conflict of interest statement
The authors declare no conflict of interest.
Figures
Similar articles
-
Gluten-Associated Medical Problems.2025 Jun 20. In: StatPearls [Internet]. Treasure Island (FL): StatPearls Publishing; 2025 Jan–. 2025 Jun 20. In: StatPearls [Internet]. Treasure Island (FL): StatPearls Publishing; 2025 Jan–. PMID: 30860740 Free Books & Documents.
-
Prevalence and etiologies of non-responsive celiac disease: A systematic review and meta-analysis.J Gastroenterol Hepatol. 2025 Jan;40(1):101-107. doi: 10.1111/jgh.16808. Epub 2024 Nov 18. J Gastroenterol Hepatol. 2025. PMID: 39557631
-
Celiac Disease and Gluten-Free Diets: A Path or Barrier to Food (In)Security?Nutrients. 2025 Jun 8;17(12):1956. doi: 10.3390/nu17121956. Nutrients. 2025. PMID: 40573067 Free PMC article.
-
Effects of a gluten-reduced or gluten-free diet for the primary prevention of cardiovascular disease.Cochrane Database Syst Rev. 2022 Feb 24;2(2):CD013556. doi: 10.1002/14651858.CD013556.pub2. Cochrane Database Syst Rev. 2022. PMID: 35199850 Free PMC article.
-
Influence of low FODMAP and gluten-free diets on disease activity and intestinal microbiota in patients with non-celiac gluten sensitivity.Clin Nutr. 2019 Apr;38(2):697-707. doi: 10.1016/j.clnu.2018.03.017. Epub 2018 Apr 4. Clin Nutr. 2019. PMID: 29653862 Clinical Trial.
References
MeSH terms
Grants and funding
LinkOut - more resources
Full Text Sources
Medical
