Review
. 2025 Jul;7(4):e240291.
doi: 10.1148/rycan.240291.

Imaging Cancer-associated Cachexia: Utilizing Clinical Imaging Modalities for Early Diagnosis

Affiliations
Review

Imaging Cancer-associated Cachexia: Utilizing Clinical Imaging Modalities for Early Diagnosis

Yang Jiang et al. Radiol Imaging Cancer. 2025 Jul.

Abstract

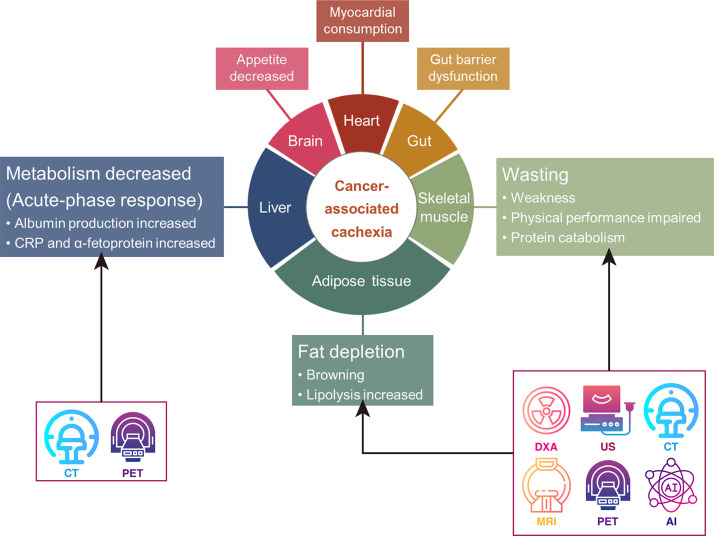
Cancer-associated cachexia (CAC) is a prevalent condition that accelerates cancer progression and heightens treatment-related adverse effects in patients by affecting multiple organ systems. Despite the profound impact of CAC on clinical management and treatment outcomes of patients with cancer, the current understanding of mechanisms associated with the condition, as well as the tools necessary for early diagnosis, are limited. Currently, the clinical diagnosis of CAC relies on weight change-based assessments, which have limited sensitivity and cannot identify patients at risk for CAC. In this context, noninvasive imaging-based biomarkers, such as the composition and properties of adipose and muscle tissues, may allow for diagnosis of CAC before substantial weight loss occurs. Such early detection can potentially enable more timely and effective interventions. Furthermore, imaging allows for quantitative assessment of CAC, enabling monitoring of prognosis and treatment response. This article reviews current applications and future developments of imaging techniques, particularly those employed in current clinical radiology, that can reveal diagnostic information and facilitate early detection of CAC and quantitative evaluation of associated metabolic alterations. Keywords: Molecular Imaging, Cancer, MRI, PET/CT, Ultrasound, Muscular, Oncology © RSNA, 2025.

Keywords: Cancer; MRI; Molecular Imaging; Muscular; Oncology; PET/CT; Ultrasound.


Conflict of interest statement

Disclosures of conflicts of interest: Y.J. No relevant relationships. Y.Z. No relevant relationships. J.D. No relevant relationships. Q.Y. No relevant relationships. X.T. No relevant relationships. L.F. No relevant relationships. H.M. Associate editor of Radiology: Imaging Cancer. X.G.P. No relevant relationships.

Figures

Diagram illustrates the use of different imaging modalities to assess cancer-associated cachexia. AI = artificial intelligence, CRP = C-reactive protein, DXA = dual-energy x-ray absorptiometry.
Figure 1:
Diagram illustrates the use of different imaging modalities to assess cancer-associated cachexia. AI = artificial intelligence, CRP = C-reactive protein, DXA = dual-energy x-ray absorptiometry.
Body composition components measured with DXA. Body mass (M) is the sum of fat, LST, and BMC. BMC = bone mineral content, DXA = dual-energy x-ray absorptiometry, LST = lean soft tissue. (Adapted and reprinted, under a CC BY 3.0 license, from reference 23.)
Figure 2:
Body composition components measured with DXA. Body mass (M) is the sum of fat, LST, and BMC. BMC = bone mineral content, DXA = dual-energy x-ray absorptiometry, LST = lean soft tissue. (Adapted and reprinted, under a CC BY 3.0 license, from reference .)
(A) Axial US imaging shows echogenicity measurement; yellow circle, region of interest; white arrowhead, the mean echogenicity value from the histogram; red rectangle, a schematic representation of the transducer’s position. (Reprinted, under a CC BY 4.0 license, from reference 32.) (B) Exemplary US image of a cross-section of the quadriceps. All quadriceps muscles (vastus medialis [VM], rectus femoris [RF], vastus lateralis [VL], vastus intermedius [VI]) were captured in a single motion. The femur (F) is also discernible within the thigh. (Adapted and reprinted, under a CCBY NC ND 4.0 license, from reference 39.)
Figure 3:
(A) Axial US imaging shows echogenicity measurement; yellow circle, region of interest; white arrowhead, the mean echogenicity value from the histogram; red rectangle, a schematic representation of the transducer’s position. (Reprinted, under a CC BY 4.0 license, from reference .) (B) Exemplary US image of a cross-section of the quadriceps. All quadriceps muscles (vastus medialis [VM], rectus femoris [RF], vastus lateralis [VL], vastus intermedius [VI]) were captured in a single motion. The femur (F) is also discernible within the thigh. (Adapted and reprinted, under a CCBY NC ND 4.0 license, from reference .)
(A) MR elastography assessment of biceps brachii stiffness in the right arm under varying loads in a healthy male individual lying in the right lateral decubitus position. The images show muscle orientation and driver placement, with wave patterns for 0-, 4-, and 8-kg loads, indicating muscle stiffness with higher loads. (Reprinted, under a CC BY 4.0 license, from reference 76.) (B) The proton density fat fraction (PDFF) maps of the psoas and erector spinae muscles (highlighted in red) in a 56-year-old male individual with esophagogastric junction adenocarcinoma show a decrease in PDFF over 218 days. (Reprinted, under a CC BY 4.0 license, from reference 80.) (C) MRI employs chemical shift-selective imaging in both healthy control mice and mice with pancreatic cancer, demonstrating metabolic changes in white adipose tissue (WAT). CSSI = chemical shift-selective imaging, eWAT = epididymal WAT, PC = pancreatic cancer, sWAT = subcutaneous WAT. (Adapted and reprinted, under a CC BY 4.0 license, from reference 83.)
Figure 4:
(A) MR elastography assessment of biceps brachii stiffness in the right arm under varying loads in a healthy male individual lying in the right lateral decubitus position. The images show muscle orientation and driver placement, with wave patterns for 0-, 4-, and 8-kg loads, indicating muscle stiffness with higher loads. (Reprinted, under a CC BY 4.0 license, from reference .) (B) The proton density fat fraction (PDFF) maps of the psoas and erector spinae muscles (highlighted in red) in a 56-year-old male individual with esophagogastric junction adenocarcinoma show a decrease in PDFF over 218 days. (Reprinted, under a CC BY 4.0 license, from reference .) (C) MRI employs chemical shift-selective imaging in both healthy control mice and mice with pancreatic cancer, demonstrating metabolic changes in white adipose tissue (WAT). CSSI = chemical shift-selective imaging, eWAT = epididymal WAT, PC = pancreatic cancer, sWAT = subcutaneous WAT. (Adapted and reprinted, under a CC BY 4.0 license, from reference .)
Representative PET/CT images of two patients with lung cancer. (A–D) A 60-year-old female individual with cachexia shows lower peak liver SUV (2.22), higher minimum visceral fat SUL (0.50), and subcutaneous fat SUL (0.26). (E–H) A 59-year-old female individual without cancer-associated cachexia, with higher peak liver SUV (2.98), lower minimum visceral fat SUL (0.16), and subcutaneous fat SUL (0.07). Both patients were female individuals under 65 years old, with a BMI more than 20 and WBC less than 9.5×10⁹/L. However, the patient with cachexia showed lower peak liver SUV and higher minimum visceral and subcutaneous fat SUL compared with the patient without cachexia. BMI = body mass index, SUL = standardized uptake value normalized by lean body mass, SULmin = minimum standardized uptake value normalized by lean body mass, SUV = standardized uptake value, SUVpeak = peak standardized uptake value, WBC = white blood cell. (Adapted and reprinted, with permission, from reference 89.)
Figure 5:
Representative PET/CT images of two patients with lung cancer. (A–D) A 60-year-old female individual with cachexia shows lower peak liver SUV (2.22), higher minimum visceral fat SUL (0.50), and subcutaneous fat SUL (0.26). (E–H) A 59-year-old female individual without cancer-associated cachexia, with higher peak liver SUV (2.98), lower minimum visceral fat SUL (0.16), and subcutaneous fat SUL (0.07). Both patients were female individuals under 65 years old, with a BMI more than 20 and WBC less than 9.5×10⁹/L. However, the patient with cachexia showed lower peak liver SUV and higher minimum visceral and subcutaneous fat SUL compared with the patient without cachexia. BMI = body mass index, SUL = standardized uptake value normalized by lean body mass, SULmin = minimum standardized uptake value normalized by lean body mass, SUV = standardized uptake value, SUVpeak = peak standardized uptake value, WBC = white blood cell. (Adapted and reprinted, with permission, from reference .)
Fully convolutional neural network–based adipose and muscle tissue segmentations on abdominal CT images at the third lumbar vertebra. (A) Integrated depiction of all segmented areas. (B–D) Segmentation maps distinguish subcutaneous fat (B, highlighted in red), skeletal muscle (C, highlighted in purple), and visceral fat (D, highlighted in green). The Dice similarity coefficients stand at 0.98, 0.99, and 0.98 for subcutaneous fat, skeletal muscle, and visceral fat, respectively. (Adapted and reprinted, under a CC BY 4.0 license, from reference 105.)
Figure 6:
Fully convolutional neural network–based adipose and muscle tissue segmentations on abdominal CT images at the third lumbar vertebra. (A) Integrated depiction of all segmented areas. (B–D) Segmentation maps distinguish subcutaneous fat (B, highlighted in red), skeletal muscle (C, highlighted in purple), and visceral fat (D, highlighted in green). The Dice similarity coefficients stand at 0.98, 0.99, and 0.98 for subcutaneous fat, skeletal muscle, and visceral fat, respectively. (Adapted and reprinted, under a CC BY 4.0 license, from reference .)

Similar articles

References

    1. Fearon K , Strasser F , Anker SD , et al . Definition and classification of cancer cachexia: an international consensus . Lancet Oncol 2011. ; 12 ( 5 ): 489 – 495 . - PubMed
    1. Baracos VE , Martin L , Korc M , Guttridge DC , Fearon KCH . Cancer-associated cachexia . Nat Rev Dis Primers 2018. ; 4 : 17105 . - PubMed
    1. Nishie K , Nishie T , Sato S , Hanaoka M . Update on the treatment of cancer cachexia . Drug Discov Today 2023. ; 28 ( 9 ): 103689 . - PubMed
    1. Schmidt SF , Rohm M , Herzig S , Berriel Diaz M . Cancer cachexia: more than skeletal muscle wasting . Trends Cancer 2018. ; 4 ( 12 ): 849 – 860 . - PubMed
    1. Tisdale MJ . Cachexia in cancer patients . Nat Rev Cancer 2002. ; 2 ( 11 ): 862 – 871 . - PubMed

MeSH terms

LinkOut - more resources