

Airborne infection risk assessment of COVID-19 in an inpatient department through on-site occupant behavior surveys
- PMID: 40477585
- PMCID: PMC8864063
- DOI: 10.1016/j.jobe.2022.104255
Airborne infection risk assessment of COVID-19 in an inpatient department through on-site occupant behavior surveys
Abstract
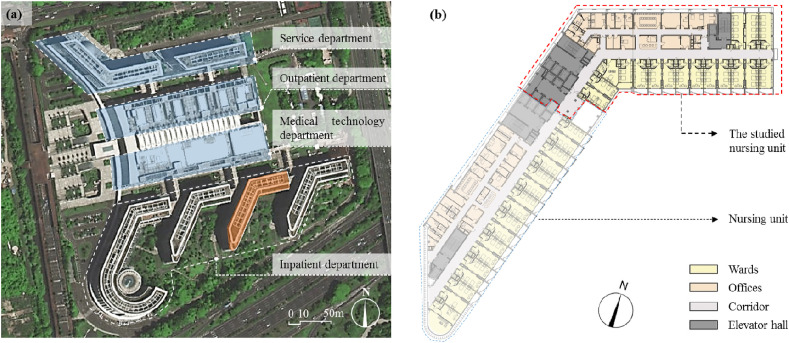
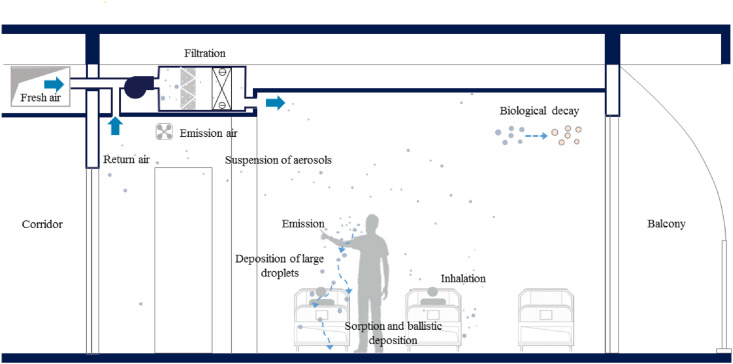
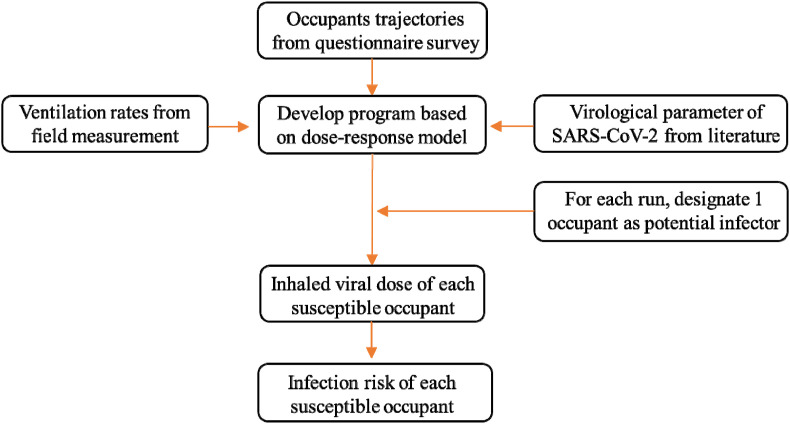
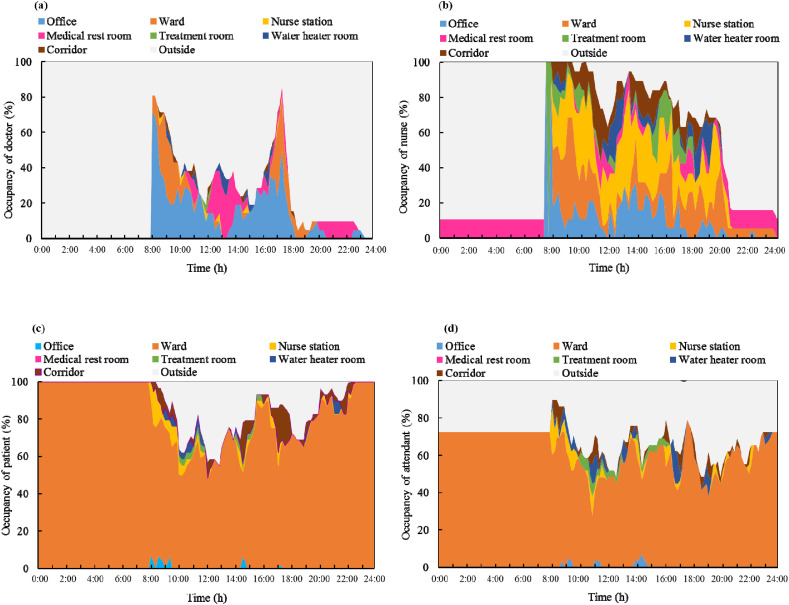
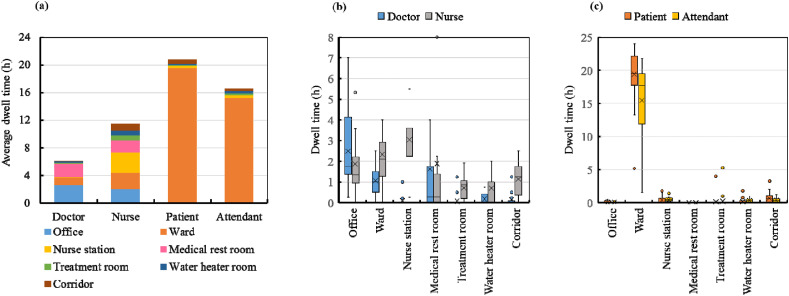
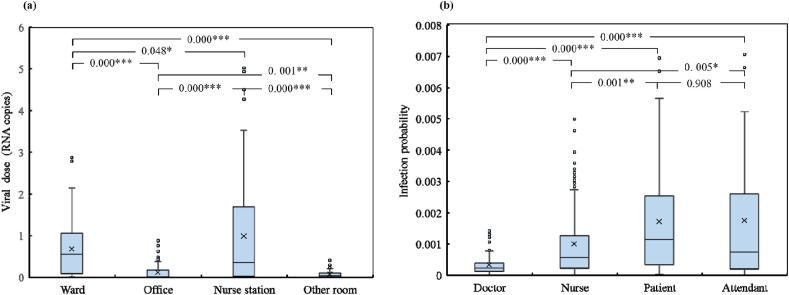
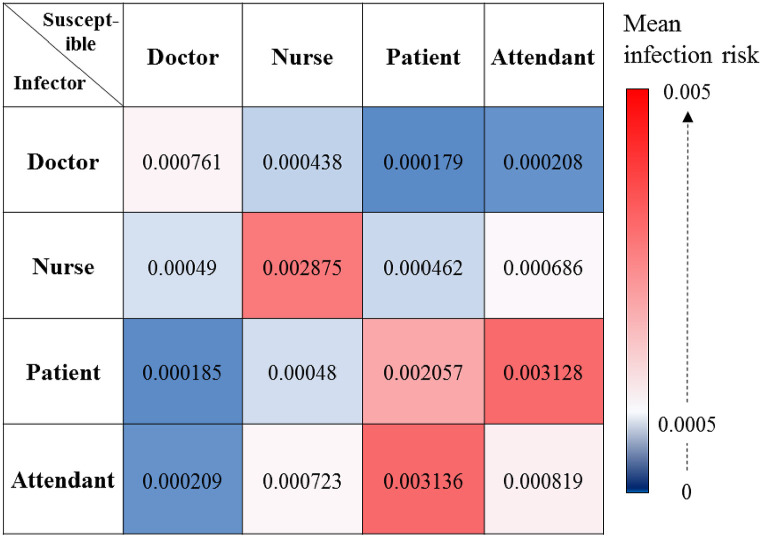
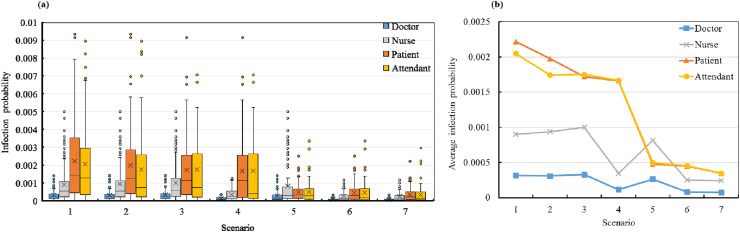
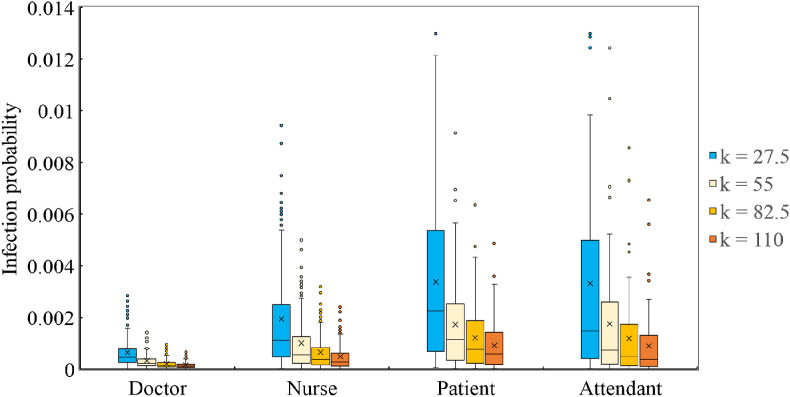
Airborne transmission is a possible infection route of the coronavirus disease 2019 (COVID-19). This investigation focuses on the airborne infection risk of COVID-19 in a nursing unit in an inpatient building in Shenzhen, China. On-site measurements and questionnaire surveys were conducted to obtain the air change rates and occupant trajectories, respectively. The aerosol transport and dose-response models were applied to evaluate the infection risk. The average outdoor air change rate measured in the wards was 1.1 h-1, which is below the minimum limit of 2.0 h-1 required by ASHRAE 170-2021. Considering the surveyed occupant behavior during one week, the patients and their attendants spent an average of 19.4 h/d and 15.1 h/d, respectively, in the wards, whereas the nurses primarily worked in the nurse station (3.0 h/d) and wards (2.4 h/d). The doctors primarily worked in their offices (2.6 h/d) and wards (1.1 h/d). Assuming one undetected COVID-19 infector emitting severe acute respiratory syndrome coronavirus 2 (SARS-CoV-2) in the nursing unit, we calculated the accumulated viral dose and infection probabilities of the occupants. After one week, the cumulative infection risks of the patients and attendants were almost equal (0.002), and were higher than those of the nurses (0.0013) and doctors (0.0004). Proper protection measures, such as reducing the number of attendants, increasing the air change rate, and wearing masks, were found to reduce the infection risk. It should be noted that the reported results are based on several assumptions, such as the speculated virological properties of SARS-CoV-2 and the particular trajectories of occupants. Moreover, only second generations of transmission were taken into consideration, whereas in reality, the week-long exposure may cause third generation of transmission or worse.
Keywords: COVID-19; Infection risk; Inpatient department; Occupant behavior.
© 2022 Elsevier Ltd. All rights reserved.
Conflict of interest statement
The authors declare that they have no known competing financial interests or personal relationships that could have appeared to influence the work reported in this paper.
Figures
References
-
- Akbari P., Yazdanfar S., Hosseini S., Norouzian-Maleki S. Housing and mental health during outbreak of COVID-19. J. Build. Eng. 2021;43:102919. doi: 10.1016/j.jobe.2021.102919. - DOI
-
- Bhattacharya A., Ghahramani A., Mousavi E. The effect of door opening on air-mixing in a positively pressurized room: implications for operating room air management during the COVID outbreak. J. Build. Eng. 2021;44 doi: 10.1016/j.jobe.2021.102900. 102900. - DOI
LinkOut - more resources
Full Text Sources
Miscellaneous