Mineral Content and Extracellular Matrix Protein Expression in Mouse Growth Plates During Epiphyseal Fusion: An Observational Study
- PMID: 40478277
- PMCID: PMC12144044
- DOI: 10.1007/s00223-025-01391-9
Mineral Content and Extracellular Matrix Protein Expression in Mouse Growth Plates During Epiphyseal Fusion: An Observational Study
Abstract
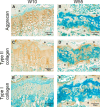
In humans, the growth plate cartilage is completely replaced by bone in late puberty, resulting in epiphyseal fusion. However, in rats and mice, commonly used experimental model systems, the growth plate does not fuse completely even after sexual maturation, making it difficult to elucidate mechanisms involved in epiphyseal fusion. In this study, we investigated age-related changes in the mouse growth plate to better understand the process of epiphyseal fusion. We used scanning electron microscopy and energy-dispersive X-ray spectroscopy (SEM/EDS) to examine the distributions and concentrations of minerals in the growth plate. In SEM images, the hypertrophic zone was observed as a bright area and other zones as dark areas at 10 weeks of age (W10). The bright area was further expanded at W55 than at W10. EDS analysis showed that P and Ca concentrations were high in this area, while C and O concentrations were low, indicating that the growth plate had calcified during aging. Alcian blue histochemistry revealed that the glycosaminoglycans of aggrecan were distributed in the growth plate at both W10 and W55. Immunohistochemistry showed that aggrecan and type II collagen were expressed throughout the growth plate at W10, but sparsely at W55. Type I collagen was expressed weak at both W10 and W55. Type X collagen and MMP-13 expression were observed in the hypertrophic zone at W10 but not at W55. This study demonstrated that although the mouse growth plate calcifies with age, it remains calcified cartilage for an extended period without being replaced by bone.
Keywords: Aging; Calcified cartilage; Epiphyseal fusion; Extracellular matrix; Growth plate; Scanning electron microscopy and energy-dispersive X-ray spectroscopy (SEM/EDS).
© 2025. The Author(s).
Conflict of interest statement
Declarations. Competing Interests: The authors Xinhang Yu, Megumi Nakamura, Miyuki Mayanagi, Itaru Mizoguchi, and Yasuyuki Sasano have no competing interests to declare. Human and Animal Rights and Informed Consent: All procedures involving animals were approved by the Institutional Laboratory Animal Care and Use Committee of Tohoku University.
Figures


Similar articles
-
The effectiveness and cost-effectiveness of carmustine implants and temozolomide for the treatment of newly diagnosed high-grade glioma: a systematic review and economic evaluation.Health Technol Assess. 2007 Nov;11(45):iii-iv, ix-221. doi: 10.3310/hta11450. Health Technol Assess. 2007. PMID: 17999840
-
Intravenous magnesium sulphate and sotalol for prevention of atrial fibrillation after coronary artery bypass surgery: a systematic review and economic evaluation.Health Technol Assess. 2008 Jun;12(28):iii-iv, ix-95. doi: 10.3310/hta12280. Health Technol Assess. 2008. PMID: 18547499
-
Home treatment for mental health problems: a systematic review.Health Technol Assess. 2001;5(15):1-139. doi: 10.3310/hta5150. Health Technol Assess. 2001. PMID: 11532236
-
Systemic pharmacological treatments for chronic plaque psoriasis: a network meta-analysis.Cochrane Database Syst Rev. 2021 Apr 19;4(4):CD011535. doi: 10.1002/14651858.CD011535.pub4. Cochrane Database Syst Rev. 2021. Update in: Cochrane Database Syst Rev. 2022 May 23;5:CD011535. doi: 10.1002/14651858.CD011535.pub5. PMID: 33871055 Free PMC article. Updated.
-
Sertindole for schizophrenia.Cochrane Database Syst Rev. 2005 Jul 20;2005(3):CD001715. doi: 10.1002/14651858.CD001715.pub2. Cochrane Database Syst Rev. 2005. PMID: 16034864 Free PMC article.
References
-
- Pines M, Hurwitz S (1991) The role of the growth plate in longitudinal bone growth. Poult Sci 70:1806–1814. 10.3382/ps.0701806 - PubMed
-
- van der Eerden BC, Karperien M, Wit JM (2003) Systemic and local regulation of the growth plate. Endocr Rev 24:782–801. 10.1210/er.2002-0033 - PubMed
-
- Ballock RT, O’Keefe RJ (2003) The biology of the growth plate. J Bone Jt Surg Am 85:715–726 - PubMed
-
- Nilsson O, Baron J (2004) Fundamental limits on longitudinal bone growth: growth plate senescence and epiphyseal fusion. Trends Endocrinol Metab 15:370–374. 10.1016/j.tem.2004.08.004 - PubMed
Publication types
MeSH terms
Substances
Grants and funding
LinkOut - more resources
Full Text Sources
Medical

