Analysis of the splicing landscape of the frontal cortex in FTLD-TDP reveals subtype specific patterns and cryptic splicing
- PMID: 40478310
- PMCID: PMC12143990
- DOI: 10.1007/s00401-025-02901-7
Analysis of the splicing landscape of the frontal cortex in FTLD-TDP reveals subtype specific patterns and cryptic splicing
Abstract
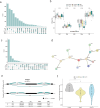
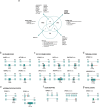
Dysregulation of TDP-43 as seen in TDP-43 proteinopathies leads to specific RNA splicing dysfunction. While discovery studies have explored novel TDP-43-driven splicing events in induced pluripotent stem cell (iPSC)-derived neurons and TDP-43 negative neuronal nuclei, transcriptome-wide investigations in frontotemporal lobar degeneration with TDP-43 aggregates (FTLD-TDP) brains remain unexplored. Such studies hold promise for identifying widespread novel and relevant splicing alterations in FTLD-TDP patient brains. We conducted the largest differential splicing analysis (DSA) using bulk short-read RNAseq data from frontal cortex (FCX) tissue of 127 FTLD-TDP (A, B, C, GRN and C9orf72 carriers) and 22 control subjects (Mayo Clinic Brain Bank), using Leafcutter. In addition, long-read bulk cDNA sequencing data were generated from FCX of 9 FTLD-TDP and 7 controls and human TARDBP wildtype and knock-down iPSC-derived neurons. Publicly available RNAseq data (MayoRNAseq, MSBB and ROSMAP studies) from Alzheimer's disease patients (AD) was also analyzed. Our DSA revealed extensive splicing alterations in FTLD-TDP patients with 1881 differentially spliced events, in 892 unique genes. When evaluating differences between FTLD-TDP subtypes, we found that C9orf72 repeat expansion carriers carried the most splicing alterations after accounting for differences in cell-type proportions. Focusing on cryptic splicing events, we identified STMN2 and ARHGAP32 as genes with the most abundant and differentially expressed cryptic exons between FTLD-TDP patients and controls in the brain, and we uncovered a set of 17 cryptic events consistently observed across studies, highlighting their potential relevance as biomarkers for TDP-43 proteinopathies. We also identified 16 cryptic events shared between FTLD-TDP and AD brains, suggesting potential common splicing dysregulation pathways in neurodegenerative diseases. Overall, this study provides a comprehensive map of splicing alterations in FTLD-TDP brains, revealing subtype-specific differences and identifying promising candidates for biomarker development and potential common pathogenic mechanisms between FTLD-TDP and AD.
Keywords: Frontotemporal dementia; Splicing; TDP-43; Transcriptomics.
© 2025. The Author(s).
Conflict of interest statement
Declarations. Conflict of interest: RR receives invention royalties from a patent related to progranulin. KAJ is an Associate Editor of Annals of Clinical and Translational Neurology. KAJ, KS and RR are associated editors at Acta Neuropathologica. The rest of the authors have no competing interests to declare that are relevant to the content of this article. Ethical approval and consent to participate: This study was approved by the University of Antwerp and Mayo Clinic Institutional Review Boards. The collection of tissue samples was approved by the Mayo Clinic Institutional Review Board. All autopsies were obtained after consent by the legal next-of-kin or someone legally authorized to make this decision. Autopsies are performed with the explicit assumption that the tissue will be used for both diagnostic evaluation and research.
Figures


References
Publication types
MeSH terms
Substances
Grants and funding
- U01 AG046152/AG/NIA NIH HHS/United States
- BOF 49758/Bijzonder Onderzoeksfonds UAntwerp, Belgium
- RF1 NS123052/NH/NIH HHS/United States
- P50 AG016574/AG/NIA NIH HHS/United States
- R01 AG017917/AG/NIA NIH HHS/United States
- P30 AG010161/AG/NIA NIH HHS/United States
- R01 AG032990/AG/NIA NIH HHS/United States
- R01 NS080820/NS/NINDS NIH HHS/United States
- U01 AG046139/AG/NIA NIH HHS/United States
- R35 NS097261/NH/NIH HHS/United States
- R01 AG018023/AG/NIA NIH HHS/United States
- U01 AG061356/AG/NIA NIH HHS/United States
- P50 AG016574/NH/NIH HHS/United States
- R01 AG030146/AG/NIA NIH HHS/United States
- R35 NS097261/NS/NINDS NIH HHS/United States
- 2022-001/Association for Frontotemporal Degeneration
- P01 AG003949/AG/NIA NIH HHS/United States
- U24 NS072026/NS/NINDS NIH HHS/United States
- WT_/Wellcome Trust/United Kingdom
- P30 AG019610/AG/NIA NIH HHS/United States
- P50 AG025711/AG/NIA NIH HHS/United States
- W81XWH-21-1-07-12/Office of the Assistant Secretary of Defense for Health Affairs
- RF1 NS123052/NS/NINDS NIH HHS/United States
- P01 AG017216/AG/NIA NIH HHS/United States
- U01 AG006786/AG/NIA NIH HHS/United States
- R01 AG036836/AG/NIA NIH HHS/United States
- R01 AG015819/AG/NIA NIH HHS/United States
LinkOut - more resources
Full Text Sources
Miscellaneous

