. 2025 Jun 6;28(3):32.
doi: 10.1007/s10456-025-09985-5.

High-throughput differentiation of human blood vessel organoids reveals overlapping and distinct functions of the cerebral cavernous malformation proteins

Affiliations

High-throughput differentiation of human blood vessel organoids reveals overlapping and distinct functions of the cerebral cavernous malformation proteins

Dariush Skowronek et al. Angiogenesis. .

Abstract

Cerebral cavernous malformations (CCMs) are clusters of thin-walled enlarged blood vessels in the central nervous system that are prone to recurrent hemorrhage and can occur in both sporadic and familial forms. The familial form results from loss-of-function variants in the CCM1, CCM2, or CCM3 gene. Despite a better understanding of CCM pathogenesis in recent years, it is still unclear why CCM3 mutations often lead to a more aggressive phenotype than CCM1 or CCM2 variants. By combining high-throughput differentiation of blood vessel organoids from human induced pluripotent stem cells (hiPSCs) with a CCM1, CCM2, or CCM3 knockout, single-cell RNA sequencing, and high-content imaging, we uncovered both shared and distinct functions of the CCM proteins. While there was a significant overlap of differentially expressed genes in fibroblasts across all three knockout conditions, inactivation of CCM1, CCM2, or CCM3 also led to specific gene expression patterns in neuronal, mesenchymal, and endothelial cell populations, respectively. Taking advantage of the different fluorescent labels of the hiPSCs, we could also visualize the abnormal expansion of CCM1 and CCM3 knockout cells when differentiated together with wild-type cells into mosaic blood vessel organoids. In contrast, CCM2 knockout cells showed even reduced proliferation. These observations may help to explain the less severe clinical course in individuals with a pathogenic variant in CCM2 and to decode the molecular and cellular heterogeneity in CCM disease. Finally, the excellent scalability of blood vessel organoid differentiation in a 96-well format further supports their use in high-throughput drug discovery and other biomedical research studies.

Keywords: Blood vessel organoids; CRISPR/Cas9 genome editing; Cerebral cavernous malformations; Human induced pluripotent stem cells; Single-cell RNA sequencing.


Conflict of interest statement

Declarations. Conflict of interest: The authors declare no competing interests. The here described protocol for high-throughput organoid synthesis has been filed as a patent application at the European Patent Office (Process number: EP24213596.0) Ethical approval: This study does not involve human participants or animal subjects.

Figures
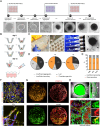
Fig. 1
Fig. 1
High-throughput (HT)-compatible and nearly xeno-free synthesis of vascular networks and blood vessel organoids from fluorescently tagged human induced pluripotent stem cells (hiPSCs). A Schematic illustration of the new differentiation protocol and representative images for the main differentiation steps (scale bars: d-2, d0, d3, d5 = 100 µm; d7, d12 = 250 µm; d14, d17 = 500 µm). Created in BioRender. Skowronek, D. (2025) https://BioRender.com/e70e302. B Shown are the steps of embedding the vascular aggregates in an Akura 96-well plate and transferring the vascular networks from the Akura 96-well plate to a PrimeSurface 96 Slit-well plate. C The use of PrimeSurface 96 Slit-well plates reduces the time required for medium exchange (left image). Akura 96-well plates allow aggregates to be embedded in small cavities, minimizing the matrix surrounding the vascular networks (black arrows) and allowing direct transfer of vascular networks (white arrows) to new plates without time-consuming manual extraction of the networks from the gel (middle and right images). D The new protocol is simple to handle and achieves high synthesis efficiency after minimal training. Shown are the efficiencies of three training runs. E The sprouting efficiency is maintained when fetal bovine serum (FBS) is replaced with human platelet lysate (hPL) or chemically defined Panexin CD (PCD). The total numbers of sufficiently sprouted networks and vascular aggregates with insufficient sprouting are written inside the bars. F,G HiPSC-derived vascular networks (F) and blood vessel organoids (G) differentiated with the HT-compatible and nearly xeno-free protocol consist of a complex network of endothelial cells (CD31) and associated pericytes (PDGFR-β) [representative images; scale bars: 50 µm (F); 200 µm (G)]. White arrowheads indicate angiogenic sprouts. H Perfusion of vascular networks with TMR-amino-dextran in OrganoPlate graft plates shows anastomoses between the GFP-labeled vascular networks and the HUVEC-derived vascular bed (top, white arrowheads) as well as correct formation and permeability of the vascular networks (bottom, scale bar: 50 µm)
Fig. 2
Fig. 2
Perfusion of blood vessel organoids (BVO) on chorioallantoic membranes (CAM). A Schematic illustration of the perfusion approach. Created in BioRender. Skowronek, D. (2025) https://BioRender.com/n06n764. B Shown are blood vessel organoids cultivated on the CAM associated with chicken blood vessels. The pictures were taken on day 1 and day 6 (scale bars = 2 mm). C Sectioning and H&E staining demonstrated nucleated chicken erythrocytes within the vascular structures of the blood vessel organoid (black arrow head) (upper scale bar = 500 µm; bottom scale bar = 25 µm). D The expression of CD31 (upper image) and PDGFR-β (lower image) were verified by immunohistochemistry staining (brown) (scale bar = 100 µm)
Fig. 3
Fig. 3
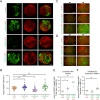
Size differences between WT and KO aggregates. A Schematic illustration of the initial hiPSC aggregation and the induction of mesodermal and vascular differentiation. Created in BioRender. Skowronek, D. (2025) https://BioRender.com/c48w302. B Shown are representative images of wild-type (WT; left half of each image) and CCM1, CCM2, and CCM3 knockout aggregates (KO; right half of each image) on days 3 and 5 (initial seeding density: 1,600 cells/well, scale bars: 100 µm). C-E WT and CCM1 (C), WT and CCM2 (D), WT and CCM3 (E) KO hiPSCs were seeded with variable seeding densities (200 to 1,800 cells/well) at d-2. The cross-sectional area of the aggregates was determined on days 0, 3, and 5. Shown are individual data points, line represents mean, n = 12–24 per genotype in three independent biological replicates. Multiple two-sample t-tests with Welch's correction and Holm-Šídák adjustment for multiple testing were used for statistical analyses (ns = Padj ≥ 0.05; * = Padj < 0.05; ** = Padj < 0.01; *** = Padj < 0.001). F Staining of tight junction protein 1 (= zonula occludens protein 1/ZO-1) revealed cell free cavities (white arrows) in CCM1 and CCM3 KO vascular aggregates (scale bars: 50 µm)
Fig. 4
Fig. 4
Structural defects in KO vascular networks. A Immunofluorescence staining for CD31 (endothelial marker, green) and PDGFR-β (pericyte marker, red) indicated a reduced correlation between ECs and pericytes in CCM1, CCM2, and CCM3 KO vascular networks (scale bar: 100 µm). Correlation was evaluated by using the Pearson’s correlation coefficient (r) calculated with the JACoP ImageJ plugin. B, C Immunofluorescence staining for ZO-1 (B) and VE-cadherin (C) revealed irregular tight and adherens junctions in CCM1, CCM2, and CCM3 KO vascular networks (Alexa 647; scale bars: 25 µm). Statistical analyses demonstrated a significant reduction of Alexa 647 (ZO-1) fluorescence intensity in CCM2 and CCM3 KO networks. Data are presented as individual data points and means. Multiple two-sample t-tests with Welch's correction and Holm-Šídák adjustment for multiple testing were used for statistical analyses (* = Padj < 0.05)
Fig. 5
Fig. 5
Changes in cellular composition of KO blood vessel organoids. A Experimental design of the single-cell RNA sequencing (scRNA-seq) experiments for KO and WT organoids. Created in BioRender. Skowronek, D. (2025) https://BioRender.com/buao0as. B Uniform Manifold Approximation and Projection (UMAP) visualization of the scRNA-seq data with cells colored according to the unsupervised clustering results. C UMAP plots colored by the expression levels of marker genes predominantly expressed in endothelial, pericyte, smooth muscle and proliferating cells. Purple color indicates high expression. Low expression is indicated by grey color. D Separate UMAP plots of scRNA-seq data from CCM1 KO, CCM2 KO, CCM3 KO, and WT blood vessel organoids. The numbers represent the different clusters. E The composition of the clusters is illustrated by the proportion of CCM1 KO, CCM2 KO, CCM3 KO, and WT cells within each cluster. F The cellular composition of KO and WT blood vessel organoids is illustrated by the distribution of CCM1 KO, CCM2 KO, CCM3 KO, and WT samples into the different clusters
Fig. 6
Fig. 6
Overlapping and genotype-specific gene expression differences in KO blood vessel organoids. A Scheme of the analysis strategy and the selected comparisons. B,C Heatmaps with the numbers of significantly up- (B) and downregulated (C) genes per cluster and genotype. DEGs = differentially expressed genes. D The relationship between the total number of DEGs per genotype and cluster and the fraction of cells per cluster in the CCM1, CCM2, and CCM3 KO samples is illustrated in a bubble plot. E, F Heatmaps with the numbers of overlapping up- (E) and downregulated (F) DEGs between the different genotypes. I = CCM1 KO ∩ CCM2 KO ∩ CCM3 KO; II = CCM1 KO ∩ CCM2 KO; III = CCM2 KO ∩ CCM3 KO; IV = CCM1 KO ∩ CCM3 KO. G The main overlap DEG cluster (c10) and the signature DEG clusters per genotype (CCM1 KO: c8; CCM2 KO: c3; CCM3 KO: c9) are highlighted in the UMAP plot. Significantly up- and downregulated genes were defined as those with a normalized.avg_logFC (KO vs. WT) > 0.5 and padj < 0.05 or with a normalized.avg_logFC (KO vs. WT) < -0.5 and padj < 0.05, respectively
Fig. 7
Fig. 7
Overlapping gene expression differences in cluster 10. A The CZ CELLxGENE Discover browser was used to visualize the tissue and cell type-specific expression levels of the top 10 marker genes identified in cluster 10. Shown are cell types that are typically found in the brain and the vasculature. Purple color indicates high expression. Low expression is indicated by yellow color. The percentage of cells of the specific cell type that express the marker gene is visualized by the size of the circles. BD Genotype-specific gene expression differences in cluster 10 are shown in Volcano plots for CCM1 (B), CCM2 (C), and CCM3 (D) KO samples. E, F Overlapping up- (E) and downregulated (F) genes were subjected to gene set enrichment analyses with the GO biological process gene set. Significantly up- and downregulated genes were defined as those with a normalized.avg_logFC (KO vs. WT) > 0.5 and padj < 0.05 or with a normalized.avg_logFC (KO vs. WT) < -0.5 and padj < 0.05, respectively. Overlapping DEGs were defined as DEGs found in CCM1, CCM2, and CCM3 KO samples (= CCM1 KO ∩ CCM2 KO ∩ CCM3 KO)
Fig. 8
Fig. 8
Abnormal proliferation of KO cells in mosaic blood vessel organoids and EC co-cultures. A In mosaic blood vessel organoids consisting of CCM1 KO and wild-type cells (= CCM1 KO/WT) or CCM3 KO and wild-type cells (= CCM3 KO/WT), abnormally increased proliferation of CCM1 KO and CCM3 KO cells was observed. In mosaic blood vessel organoids consisting of CCM2 KO and wild-type cells (= CCM2 KO/WT), a reduced proliferation of CCM2 KO cells was found. KO cells were labeled with mEGFP. WT cells were labeled either with mTagRFPT or mEGFP (scale bar: 200 µm). B Mean mEGFP intensities in mosaic organoids consisting of mEGFP-labeled KO and mTagRFPT-labeled WT cells (= KO/WT) were normalized to the mean mEGFP intensity in control mosaic organoids consisting of mEGFP-labeled WT and mTagRFPT-labeled WT cells (= WT/WT). Mosaic blood vessel organoids were differentiated in three independent runs (n = 38–48 per genotype). Data are presented as individual data points and means. Statistical significance was assessed using the Mann–Whitney U-test with Welch's correction (**P < 0.01, ***P < 0.001). C, D In a 2D co-culture validation approach, mEGFP-labeled CCM1 or CCM3 KO iECs and mTagRFPT-labeled WT iECs were seeded in a 1:9 ratio (= CCM1 KO/WT or CCM3 KO/WT) and cultivated in either EndoGRO-MV (C) or STEMdiff EC expansion medium (D). Co-cultures of mEGFP-labeled WT and mTagRFPT-labeled WT iECs (= WT/WT) served as controls (scale bar: 200 µm). E, F After 6 days, the area of mEGFP-labeled cells compared to all cells was determined using FIJI software (n = 4 per genotype in three independent biological replicates). KO/WT = co-cultures of mEGFP-labeled KO and mTagRFPT-labeled WT iECs; WT/WT = co-cultures of mEGFP-labeled WT and mTagRFPT-labeled WT iECs. Data are presented as individual data points and means. Multiple two-sample t-tests with Welch's correction and Holm-Šídák adjustment for multiple testing were used for statistical analyses (* = Padj < 0.05; ** = Padj < 0.01)

References

    1. Kim H, Jusue-Torres I, Kondziolka D, Cornelia Lee P, Morrison L, Rigamonti D, Rebeiz T, Tournier-Lasserve E, Waggoner D, Whitehead K (2017) Guidelines for the clinical management of cerebral cavernous malformations: consensus recommendations based on systematic literature review by the angioma alliance scientific advisory board clinical experts panel. Neurosurgery. 10.1093/neuros/nyx091 - PMC - PubMed
    1. Al-Shahi Salman R, Berg MJ, Morrison L, Awad IA (2008) Hemorrhage from cavernous malformations of the brain: definition and reporting standards. Angioma Alliance Scientific Advisory Board. Stroke 39(12):3222–3230. 10.1161/STROKEAHA.108.515544 - PubMed
    1. Spiegler S, Rath M, Paperlein C, Felbor U (2018) Cerebral cavernous malformations: an update on prevalence, molecular genetic analyses, and genetic counselling. Mol Syndromol 9(2):60–69. 10.1159/000486292 - PMC - PubMed
    1. Zafar A, Quadri SA, Farooqui M, Ikram A, Robinson M, Hart BL, Mabray MC, Vigil C, Tang AT, Kahn ML, Yonas H, Lawton MT, Kim H, Morrison L (2019) Familial cerebral cavernous malformations. Stroke 50(5):1294–1301. 10.1161/strokeaha.118.022314 - PMC - PubMed
    1. Snellings DA, Girard R, Lightle R, Srinath A, Romanos S, Li Y, Chen C, Ren AA, Kahn ML, Awad IA, Marchuk DA (2022) Developmental venous anomalies are a genetic primer for cerebral cavernous malformations. Nature Cardiovasc Res 1:246–252. 10.1038/s44161-022-00035-7 - PMC - PubMed

MeSH terms

LinkOut - more resources