

Interobserver ground-truth variability limits performance of automated glioblastoma segmentation on [18F]FET PET
- PMID: 40478497
- PMCID: PMC12144010
- DOI: 10.1186/s40658-025-00767-y
Interobserver ground-truth variability limits performance of automated glioblastoma segmentation on [18F]FET PET
Abstract
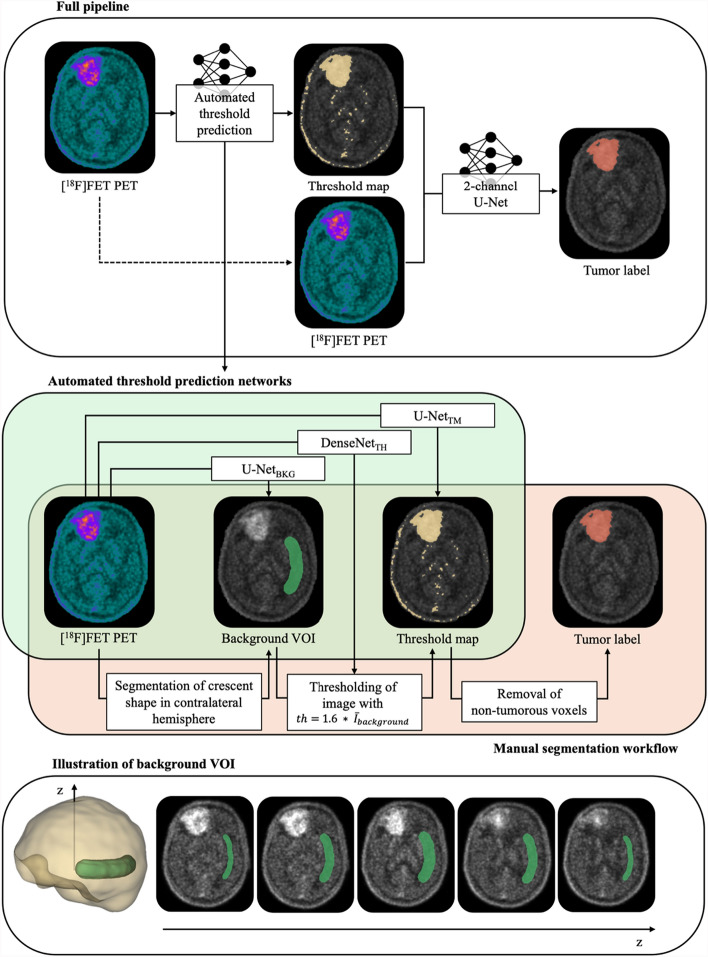
Background: Positron emission tomography (PET) with a [18F]fluoroethyl)-L-tyrosine ([18F]FET) tracer is of growing importance in the management of glioblastoma for the estimation of tumor extent and extraction of diagnostic and prognostic parameters. Robust and accurate glioblastoma segmentation methods are essential to maximize the benefits of this imaging modality. Given the importance of setting the foreground threshold during manual tumor delineation, this study investigates the added value of incorporating such prior knowledge to guide the automated segmentation and improve performance. Two segmentation networks were trained based on the nnU-Net guidelines: one with the [18F]FET PET image as sole input, and one with an additional input channel for the threshold map. For the latter, we investigate the benefit of manually obtained thresholds and explore automated prediction and generation of such maps. A fully automated pipeline was constructed by selecting the best performing threshold prediction approach and cascading this with the tumor segmentation model.
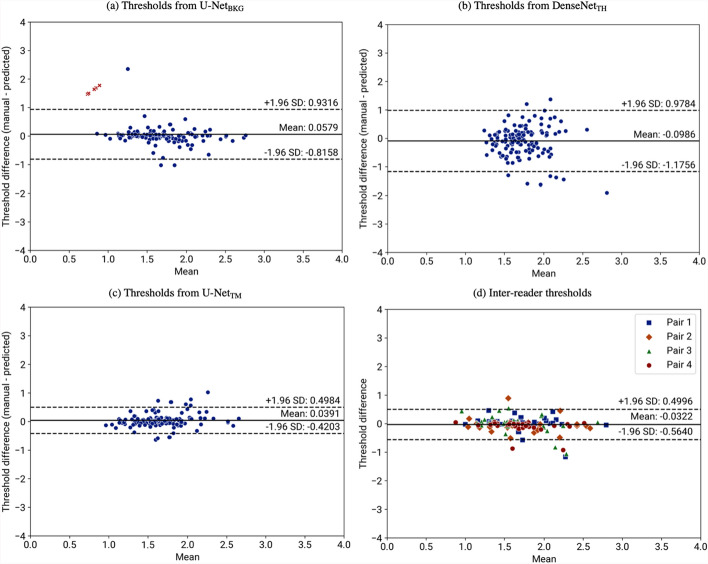
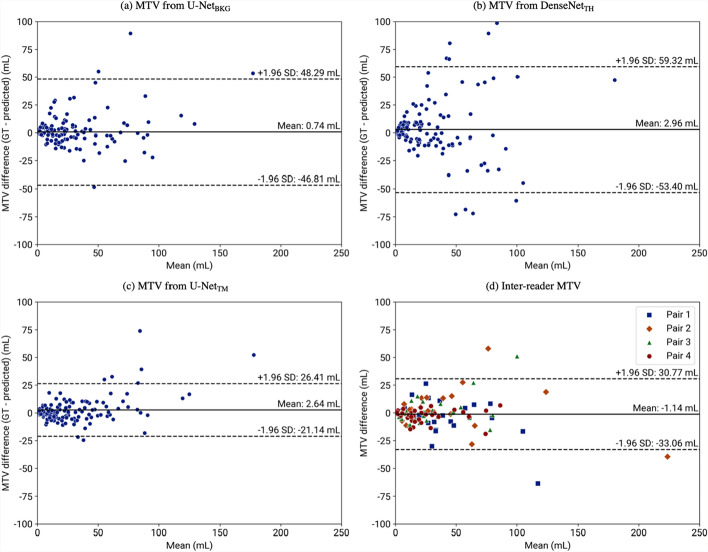
Results: The proposed two-channel network shows increased performance with guidance of threshold maps originating from the same reader whose ground-truth tumor label the prediction is compared to (DSC = 0.901). When threshold maps were generated by a different reader, performance reverted to levels comparable to the one-channel network and inter-reader variability. The proposed full pipeline achieves results on par with current state of the art (DSC = 0.807).
Conclusions: Incorporating a threshold map can significantly improve tumor segmentation performance when it aligns well with the ground-truth label. However, the current inability to reliably reproduce these maps-both manually and automatically-or the ground-truth tumor labels, restricts the achievable accuracy for automated glioblastoma segmentation on [18F]FET PET, highlighting the need for more consistent definitions of such ground-truth delineations.
Keywords: Brain; Deep learning; Glioblastoma; Positron emission tomography; Segmentation.
© 2025. The Author(s).
Conflict of interest statement
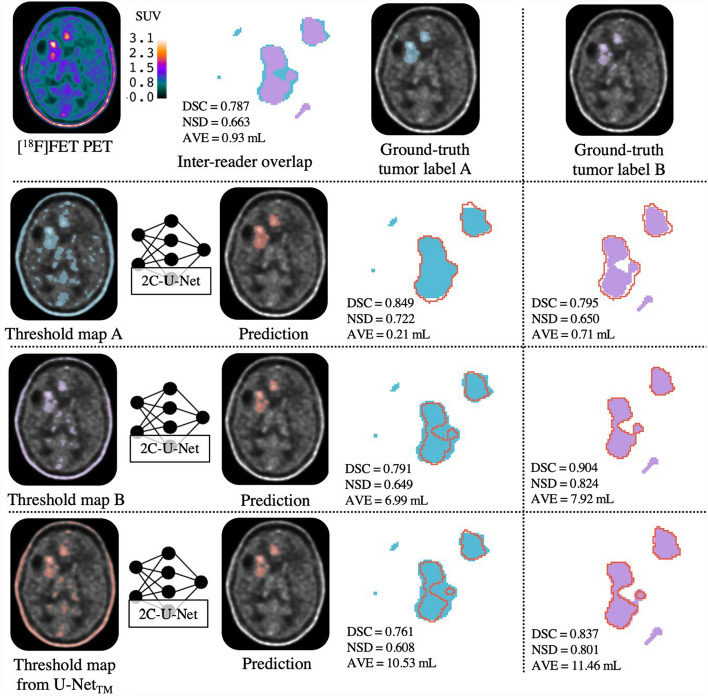
Declarations. Ethics approval and consent to participate: This single-center retrospective study was performed in line with the principles of the Declaration of Helsinki. Approval was granted by the Ethics Committee of Universitair Ziekenhuis Brussel (Commissie Medische Ethiek; protocol code EC-2021–137; date of approval 28–07-2021). This study is a retrospective analysis of data obtained during a prospective study (Axig (NCT01562197), GliAvAx (NCT03291314), and GlitIpNi (NCT03233152)), during which all patients signed informed consent for the use of their data. Consent for publication: The authors affirm that human research participants provided informed consent for publication of the images in Figs. 2 and 6. Competing interests: The authors declare that they have no competing interests.
Figures
Similar articles
-
A multi-label CNN model for the automatic detection and segmentation of gliomas using [18F]FET PET imaging.Eur J Nucl Med Mol Imaging. 2023 Jul;50(8):2441-2452. doi: 10.1007/s00259-023-06193-5. Epub 2023 Mar 18. Eur J Nucl Med Mol Imaging. 2023. PMID: 36933075
-
Automated Brain Tumor Detection and Segmentation for Treatment Response Assessment Using Amino Acid PET.J Nucl Med. 2023 Oct;64(10):1594-1602. doi: 10.2967/jnumed.123.265725. Epub 2023 Aug 10. J Nucl Med. 2023. PMID: 37562802
-
Brain tumor segmentation and detection in MRI using convolutional neural networks and VGG16.Cancer Biomark. 2025 Mar;42(3):18758592241311184. doi: 10.1177/18758592241311184. Epub 2025 Apr 4. Cancer Biomark. 2025. PMID: 40183298
-
Semi-automated segmentation methods of SSTR PET for dosimetry prediction in refractory meningioma patients treated by SSTR-targeted peptide receptor radionuclide therapy.Eur Radiol. 2023 Oct;33(10):7089-7098. doi: 10.1007/s00330-023-09697-8. Epub 2023 May 6. Eur Radiol. 2023. PMID: 37148355 Review.
-
Determining the ground truth for the prediction of delirium in adult patients in acute care: a scoping review.JAMIA Open. 2025 May 26;8(3):ooaf037. doi: 10.1093/jamiaopen/ooaf037. eCollection 2025 Jun. JAMIA Open. 2025. PMID: 40421319 Free PMC article. Review.
References
-
- Pauleit D, Stoffels G, Bachofner A, et al. Comparison of 18F-FET and 18F-FDG PET in brain tumors. Nucl Med Biol. 2009;36(7):779–87. 10.1016/j.nucmedbio.2009.05.005. - PubMed
-
- Pauleit D, Floeth F, Hamacher K, et al. O-(2-[18F] fluoroethyl)-L-tyrosine PET combined with MRI improves the diagnostic assessment of cerebral gliomas. Brain. 2005;128(3):678–87. 10.1093/brain/awh399. - PubMed
-
- Pöpperl G, Götz C, Rachinger W, Gildehaus F-J, Tonn J-C, Tatsch K. Value of O-(2-[18F] fluoroethyl)-L-tyrosine PET for the diagnosis of recurrent glioma. Eur J Nucl Med Mol Imaging. 2004;31:1464–70. 10.1007/s00259-004-1590-1. - PubMed
Grants and funding
LinkOut - more resources
Full Text Sources
