. 2025 Jun 3;135(14):e184653.
doi: 10.1172/JCI184653. eCollection 2025 Jul 15.

Panose prevents acute-on-chronic liver failure by reducing bacterial infection in mice

Affiliations

Panose prevents acute-on-chronic liver failure by reducing bacterial infection in mice

Jiaxin Li et al. J Clin Invest. .

Abstract

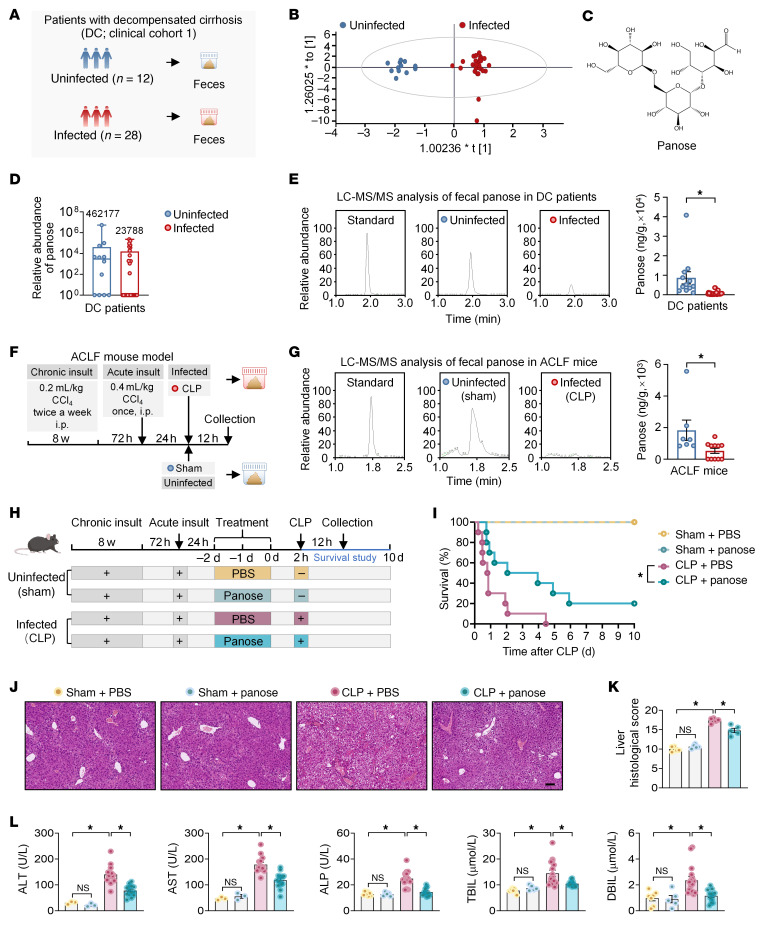
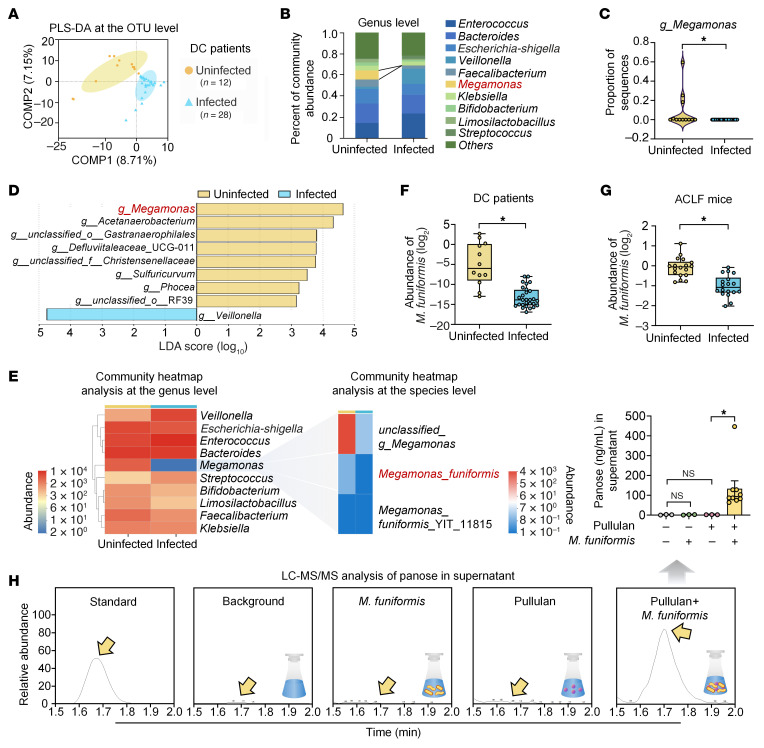
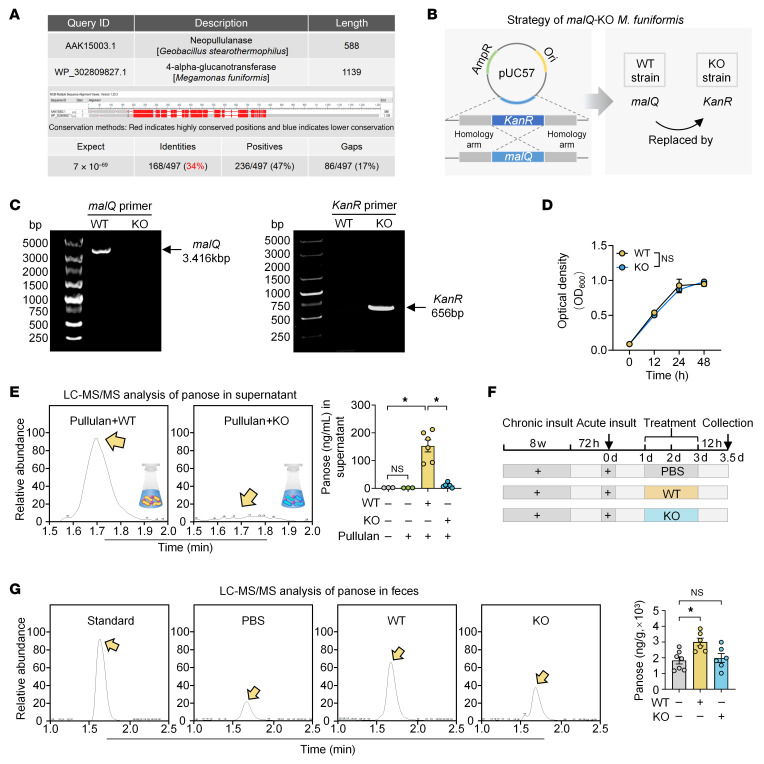
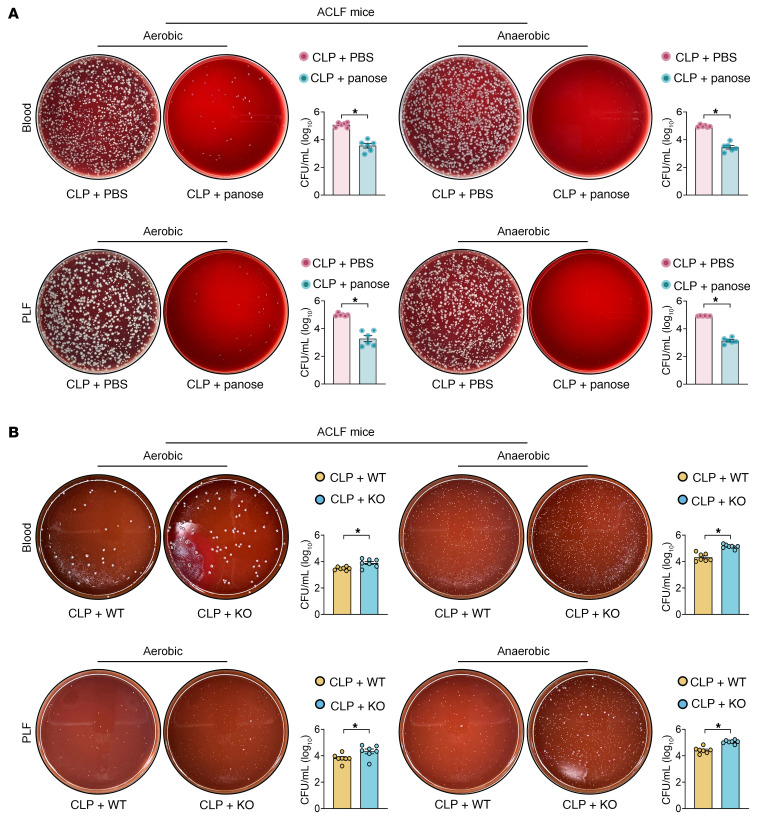
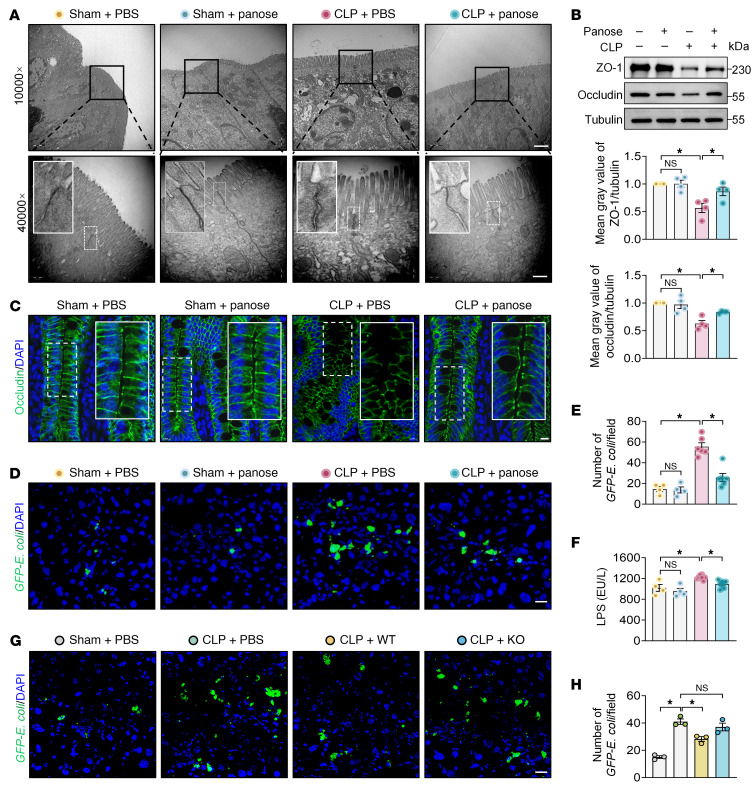
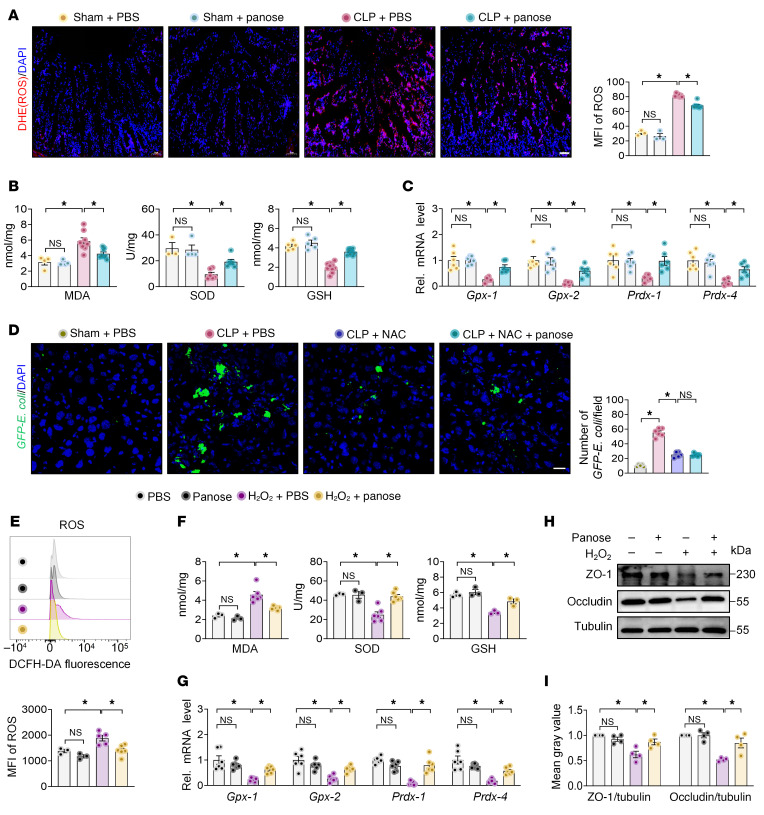
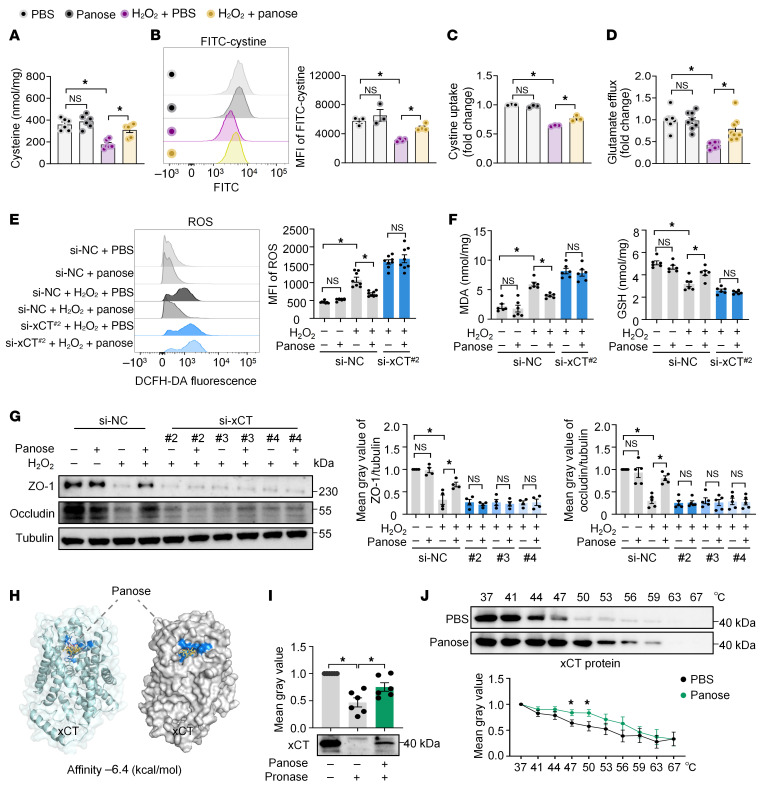
Acute-on-chronic liver failure (ACLF) is a leading cause of global liver-related mortality. Bacterial infection, especially in patients with decompensated cirrhosis, commonly triggers ACLF and is difficult to treat with antibiotics. Therefore, finding alternative strategies for preventing and managing bacterial infection is an urgent priority. Here, we observed that patients with bacterial infection and decompensated cirrhosis, as well as ACLF mice, exhibited lower fecal panose levels than uninfected controls. Megamonas funiformis, with 4α-glucanosyltransferase (4αGT) as a key enzyme for panose production, was identified as a potential panose producer. Animal experiments demonstrated that panose efficiently reduced liver injury and extended survival in ACLF mice by mitigating bacterial infection. Further results revealed that panose enhanced resistance to bacterial infection by inhibiting oxidative stress-induced gut barrier disruption, thereby limiting bacterial dissemination. Mechanistically, panose interacted with the solute carrier family 7 member 11 (SLC7A11, also known as xCT) protein to boost antioxidant glutathione levels in intestinal epithelial cells. These findings highlight panose's potential in preventing bacterial infection, offering a valuable insight into mitigating ACLF progression.

Keywords: Bacterial infections; Hepatology; Metabolism; Microbiology; Tight junctions.


Figures

Figure 1
Figure 1. Infected patients with decompensated cirrhosis and ACLF mice exhibit lower panose levels, and panose administration attenuates ACLF progression in mice.
(A) Schematic diagram of fecal sample collection from infected and uninfected patients with DC. (B) Nontargeted metabolite profiles were analyzed using OPLS-DA (n = 12–28/group). (C) Molecular structure of panose. (D) Box plot illustrating the relative abundance of panose in the fecal samples from patients with DC, with mean values indicated on the plot (n = 12–28/group). (E) Representative chromatograms and fecal panose quantification in patients with DC via LC-MS/MS (n = 12–28/group). (F) Schematic diagram of the ACLF mouse model. (G) Representative chromatograms of fecal panose levels in ACLF mice via LC-MS/MS (n = 7–11/group). (H) Schematic timeline of panose treatment and survival study in ACLF mice. (I) Kaplan-Meier survival curves for ACLF mice treated with PBS or panose (n = 5–10/group). (J) Representative images of H&E-stained liver sections from ACLF mice. Scale bar: 100 μm. (K) Liver histological scores (n = 5/group). (L) Plasma levels of liver injury markers (ALT, AST, ALP, TBIL, and DBIL) in ACLF mice (n = 3–16/group). Data are presented as median ± IQR (D) and mean ± SEM (E, G, K, and L). Statistical significance was determined by Mann-Whitney U test (E and G), log-rank test (I), and 1-way ANOVA with Bonferroni’s post hoc test (K and L). *P < 0.05. NS, nonsignificant. ACLF, acute-on-chronic liver failure; DC, decompensated cirrhosis; OPLS-DA, orthogonal partial least squares discriminant analysis; LC-MS/MS, liquid chromatography–tandem mass spectrometry; ALT, alanine aminotransferase; AST, aspartate aminotransferase; ALP, alkaline phosphatase; TBIL, total bilirubin; DBIL, direct bilirubin.
Figure 2
Figure 2. Infected patients with decompensated cirrhosis and ACLF mice have a lower abundance of M. funiformis, which produces panose from pullulan.
(A) PLS-DA score plot at the OTU level in fecal samples from patients with DC (n = 12–28/group). (B) Histogram of microbial community composition at the genus level in fecal samples from patients with DC (n = 12–28/group). (C) Violin plot illustrating the proportion of g_Megamonas sequences in fecal samples from patients with DC (n = 12–28/group). (D) Taxonomic differences at the genus level between groups were analyzed using LEfSe with an LDA score greater than 3 (n = 12–28/group). (E) Heatmap of the 10 most dominant bacterial genera in fecal samples from patients with DC (left) and Megamonas species level (right) (n = 12–28/group). (F) Relative abundance of M. funiformis in fecal samples from patients with DC determined by RT-qPCR (n = 12–28/group). (G) Relative abundance of M. funiformis in fecal samples from ACLF mice determined by RT-qPCR (n = 18/group). (H) LC-MS/MS analysis of panose levels in the supernatant of M. funiformis after 48 hours of culture with pullulan (n = 3–9/group). Data are presented as median ± IQR (C, F, and G) and mean ± SEM (H). Statistical significance was determined by Mann-Whitney U test (C and F), 2-tailed Student’s t test (G), and 1-way ANOVA with Fisher’s LSD post hoc test (H). *P < 0.05. NS, nonsignificant. DC, decompensated cirrhosis; PLS-DA, partial least squares discriminant analysis; OTU, operational taxonomic unit; LEfSe, linear discriminant analysis effect size; LDA, linear discriminant analysis.
Figure 3
Figure 3. M. funiformis generates panose from pullulan via 4αGT.
(A) Protein sequence similarity alignment was assessed by NCBI Protein BLAST. (B) The malQ-KO strain of M. funiformis was generated via homologous recombination, replacing the target gene with a KanR gene. (C) The malQ-KO strain of M. funiformis was confirmed by PCR with malQ gene-specific and KanR gene-specific primers. (D) Growth curves of WT and malQ-KO strains (n = 3/group). (E) LC-MS/MS analysis of panose levels in the supernatant of WT and malQ-KO strains after 48 hours of culture with pullulan (n = 3–6/group). (F) Schematic timeline illustrating the treatment of mice with either WT or malQ-KO strain. (G) LC-MS/MS analysis of fecal panose levels in mice treated with WT or malQ-KO strain (n = 6–7/group). Data are presented as mean ± SEM (D, E, and G). Statistical significance was determined by repeated-measures ANOVA (D) and 1-way ANOVA with Bonferroni’s post hoc test (E and G). *P < 0.05. NS, nonsignificant. 4αGT (encoded by malQ), 4α-glucanosyltransferase; KanR, kanamycin resistance.
Figure 4
Figure 4. Panose combats bacterial infection in ACLF mice.
(A and B) Representative images and statistical plots of colony formation in peripheral blood and PLF samples after incubation in aerobic or anaerobic conditions. Samples were collected at 12 hours after infection from (A) ACLF mice treated with PBS or panose (n = 6/group) and (B) ACLF mice treated with WT or malQ-KO strain (n = 7/group). All CFU values were log10-transformed. Data are presented as mean ± SEM. Statistical analysis used a 2-tailed Student’s t test. *P < 0.05. PLF, peritoneal lavage fluid.
Figure 5
Figure 5. Panose combats bacterial infection in ACLF mice by restoring the intestinal barrier.
(A) Representative TEM images of ileum TJs in ACLF mice. Scale bars: 2 μm (10,000× original magnification) and 500 nm (40,000× original magnification). (B) Western blot analysis and quantification of ZO-1 and occludin protein expression in the ileum of ACLF mice (n = 4/group). (C) Representative immunofluorescence images of occludin in the ileum of ACLF mice (green: occludin; blue: DAPI-stained nuclei). Scale bar: 10 μm. (D and G) Representative images of GFP–E. coli fluorescence intensity in the liver of ACLF mice (green: GFP–E. coli; blue: DAPI-stained nuclei). Scale bar: 20 μm. (E) Quantification of GFP–E. coli fluorescence signals in the liver tissue from PBS- or panose-treated ACLF mice (n = 4–6/group). (F) LPS levels in the plasma of ACLF mice at 12 hours after infection (n = 4–8/group). (H) Quantification of GFP–E. coli fluorescence signals in the liver tissue from ACLF mice treated with WT or malQ-KO strain (n = 3/group). Data are presented as mean ± SEM. Statistical significance was determined by 1-way ANOVA with Bonferroni’s post hoc test. *P < 0.05. NS, nonsignificant. TEM, transmission electron microscopy; TJs, tight junctions; ZO-1, zonula occludens-1.
Figure 6
Figure 6. Panose ameliorates gut barrier dysfunction by inhibiting oxidative stress.
(A) ROS levels in ileum sections of ACLF mice were visualized with DHE staining and quantified using MFI (red: ROS; blue: DAPI-stained nuclei). Scale bar: 50 μm (n = 3–7/group). (B) MDA, SOD, and GSH levels in the ileum tissue of ACLF mice (n = 3–10/group). (C) The mRNA levels of antioxidant markers (Gpx-1, Gpx-2, Prdx-1, and Prdx-4) in the ileum tissue were determined by RT-qPCR (n = 6/group). (D) Representative images and quantification of GFP–E. coli fluorescence intensity in the liver of ACLF mice after ROS elimination via NAC (green: GFP–E. coli; blue: DAPI-stained nuclei). Scale bar: 20 μm (n = 5–6/group). (EI) Mode-K cells were exposed to H2O2-induced oxidative stress for 12 hours before sample collection and analysis. (E) Intracellular ROS levels were assessed using DCFH-DA staining, measured by flow cytometry, and quantified with MFI (n = 3–6/group). (F) MDA, SOD, and GSH levels in the Mode-K cells (n = 3–6/group). (G) The mRNA levels of antioxidant markers (Gpx-1, Gpx-2, Prdx-1, and Prdx-4) in the Mode-K cells were determined by RT-qPCR (n = 6/group). (H) Western blot analysis and (I) quantification of ZO-1 and occludin protein expression (n = 4/group). Data are presented as mean ± SEM. Statistical significance was determined by 1-way ANOVA with Bonferroni’s post hoc test. *P < 0.05. NS, nonsignificant. DHE, dihydroethidium; MDA, malondialdehyde; SOD, superoxide dismutase; GSH, glutathione; Gpx-1, glutathione peroxidase 1; Gpx-2, glutathione peroxidase 2; Prdx-1, peroxiredoxin 1; Prdx-4, peroxiredoxin 4; NAC, N-acetylcysteine; DCFH-DA, 2′,7′-dichlorodihydrofluorescein diacetate.
Figure 7
Figure 7. Panose reduces intestinal oxidative stress by interacting with the xCT protein.
(AG) Mode-K cells were exposed to H2O2-induced oxidative stress for 12 hours before sample collection and analysis. (A) Intracellular cysteine levels (n = 6/group). (B) FITC-cystine uptake was measured by flow cytometry and quantified using MFI (n = 3–4/group). (C) Cystine uptake was analyzed using a fluorescent enzyme labeler at 490/535 nm (n = 3/group). (D) Glutamate efflux levels in the media (n = 8/group). (EG) Mode-K cells transfected with si-NC or si-xCT were analyzed as follows: (E) Intracellular ROS levels were assessed using DCFH-DA staining, measured by flow cytometry, and quantified with MFI (n = 8/group). (F) MDA and GSH levels (n = 6/group). (G) Western blot analysis and quantification of ZO-1 and occludin protein expression (n = 4–5/group). (H) Schematic depiction of molecular docking between panose and the extracellular structural domain of the xCT protein (PDB: 7EPZ, B chain), with a docking affinity of –6.4 kcal/mol. (I) The DARTS experiment was conducted to assess the panose-xCT protein interaction (n = 6/group). (J) The CETSA experiment was conducted to assess the panose-xCT protein interaction (n = 9/group). Data are presented as mean ± SEM. Statistical significance was determined by 1-way ANOVA with Bonferroni’s post hoc test (AG, and I) and 2-tailed Student’s t test (J). *P < 0.05. NS, nonsignificant. xCT (known as SLC7A11), solute carrier family 7 member 11; si-NC, negative control siRNA; si-xCT, xCT-specific siRNA; DARTS, drug affinity responsive target stability; CETSA, cellular thermal shift assays.

Similar articles

References

    1. Aggarwal A, et al. Definitions, etiologies, and outcomes of acute on chronic liver failure: a systematic review and meta-analysis. Clin Gastroenterol Hepatol. 2024;22(11):2199–2210. doi: 10.1016/j.cgh.2024.04.018. - DOI - PubMed
    1. Br VK, Sarin SK. Acute-on-chronic liver failure: terminology, mechanisms and management. Clin Mol Hepatol. 2023;29(3):670–689. doi: 10.3350/cmh.2022.0103. - DOI - PMC - PubMed
    1. Luo J, et al. Acute-on-chronic liver failure: far to go-a review. Crit Care. 2023;27(1):259. doi: 10.1186/s13054-023-04540-4. - DOI - PMC - PubMed
    1. Wong F, et al. Clinical features and evolution of bacterial infection-related acute-on-chronic liver failure. J Hepatol. 2021;74(2):330–339. doi: 10.1016/j.jhep.2020.07.046. - DOI - PubMed
    1. Incicco S, et al. Bacterial infections in acute on chronic liver failure. Clin Liver Dis. 2023;27(3):703–716. doi: 10.1016/j.cld.2023.03.013. - DOI - PubMed

MeSH terms