. 2025 Jun 24;44(6):115808.
doi: 10.1016/j.celrep.2025.115808. Epub 2025 Jun 4.

Spatio-temporal organization of network activity patterns in the hippocampus

Affiliations

Spatio-temporal organization of network activity patterns in the hippocampus

Vítor Lopes-Dos-Santos et al. Cell Rep. .

Abstract

Understanding how coordinated neural networks support brain functions remains a central goal in neuroscience. The hippocampus, with its layered architecture and structured inputs to diverse cell populations, is a tractable model for dissecting operating microcircuits through the analysis of electrophysiological signatures. We investigated hippocampal network patterns in behaving mice by developing a low-dimensional embedding of local field potentials recorded along the CA1-to-dentate gyrus axis. This embedding revealed layer-specific gamma profiles reflecting spatially organized rhythms and their associated principal cell-interneuron firing motifs. Moreover, firing behaviors along the CA1 radial axis distinguished between deep and superficial principal cells, as well as between interneurons from the pyramidal, radiatum, and lacunosum-moleculare layers. These findings provide a comprehensive map of spatiotemporal activity patterns underlying hippocampal network functions.

Keywords: CP: Neuroscience; firing motifs; hippocampus; network activity; neuronal populations; oscillations.


Conflict of interest statement

Declaration of interests The authors declare no competing interests.

Figures

Figure 1
Figure 1. Identification of hippocampal layers using electrophysiological patterns.
(A) Schematic of the hippocampal layers recorded using a silicon probe implanted along the CA1-DG axis. (B) Sample data showing the three network events used for layer identification. Scale bars: 100 ms. (C) Example activity profiles for layer determination (Mouse 1; see Figure S1 for other mice). The sharp-wave ripple panels display ripple power across layers, CSD analysis of LFPs aligned to ripple power peaks, and CSD values at the ripple power peak. The theta oscillation panels display the CSD aligned to the pyramidal theta descending zero-crossing, alongside normalized theta amplitude and phase shift across layers. The dentate spike panels depict CSD analysis for DS1 and DS2, with their respective CSD values at their peaks. (D) Sharp-wave and theta waveforms for CSD-defined layers (one waveform per mouse). (E) Construction of the embedding trajectory. The sharp-wave and theta waveforms recorded across layers were used to generate the embedding. Shown are the two ISOMAP components. To compute a trajectory, embedding coordinates from each layer and additional intermediate points were averaged across mice. Gray lines represent individual mice; color-coded circles show the across-mice average per layer; black circles denote intermediate points. The trajectory was defined by interpolating between the average coordinates. (F) Left: LFP-based feature embedding. Each cross represents one mouse and is color-coded as in (D); circles indicate across-mice layer averages. The trajectory is shown as a black trace. Right: Linearized representation of the trajectory. (G) Trajectory consistency analysis. Trajectory similarity was quantified via Fréchet distances. Distances were computed across sessions within a mouse or across different mice. Left: Example of two actual trajectories from different mice and a corresponding surrogate. Top right: Trajectory similarity for a representative pair along with its surrogate distribution. Bottom right: Bootstrap distributions for normalized similarity (z-scored using the surrogate distribution’s mean and standard deviation) for within-mouse and across-mice pairs. (H) Left: Confusion matrices for a classifier predicting the layer from feature space coordinates. Matrix entries represent the likelihood of predicting a specific layer given the true layer. Right: Mutual information between the actual and the predicted layers, compared to a control distribution obtained by shuffling layer labels. Abbreviations: pyr, pyramidale; rad, radiatum; l-m, lacunosum-moleculare; hf, hippocampal fissure; omol, outer molecular; mmol, mid molecular; imol, inner molecular; gr, granular.
Figure 2
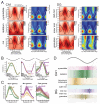
Figure 2. Theta-nested gamma profiles across individual CA1-to-DG layers.
(A) Each layer is represented by two panels displaying theta-nested gamma amplitudes. Left panels show both local (solid lines) and CA1 pyramidal layer LFPs (dashed lines), aligned to the descending zero-crossing of the pyramidal layer theta. These are overlaid on the gamma-frequency amplitudes. Right panels show each frequency’s amplitude normalized to its minimum value. Data are from a representative mouse (see Figure S3A for other mice). (B) Z-scored amplitudes for gamma bands across layers relative to the pyramidal layer theta phase. (C) Normalized power spectra calculated for each gamma rhythm in specific layers. In both (B) and (C), solid lines denote the mean across mice, and shaded regions indicate 95% confidence intervals. (D) Schematic illustrating gamma oscillations across hippocampal layers. Each gamma oscillation is placed at the theta phase where it reaches its maximum amplitude. The mid-gamma rhythm (dark orange) appears in all layers but is shown in the lacunosum-moleculare layer, where its amplitude is strongest.
Figure 3
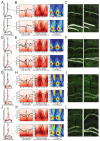
Figure 3. Validation of LFP profiles using tetrode placement in the feature embedding.
(A-C) Tetrode placement in the radiatum layer. (A) Trajectories in feature space, with each triangle representing a tetrode's projection for a recording session (connecting lines indicate session sequence). Each panel shows an example tetrode. (B) Sharp-wave and theta-gamma profiles obtained from these tetrodes immediately before perfusion. Left: SWR waveform obtained from the corresponding tetrode (solid line) and from the pyramidal layer reference (dashed line); heatmap displays amplitude across frequencies. Middle and right panels: Theta-gamma profiles as shown in Figure 2. (C) Histological confirmation of tetrode placement. Red arrowheads indicate tetrodes tips, with layers visualized using DAPI staining (white) and an empty channel (green). Scale bars: 100 μm. (D-F) Same analysis for tetrodes targeting the lacunosum-moleculare layer. Each marker represents same-day sessions, with triangles and squares indicating consecutive days. (G-I) Same analysis for tetrodes targeting the DG molecular layer. (J-L) Same analysis for tetrodes targeting the DG granular layer. Circles indicate a third recording day.
Figure 4
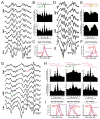
Figure 4. Spiking correlates of CA1 principal cells and interneurons to gamma rhythms.
(A-C) Spike correlates of radiatum slow gamma. (A) Example silicon probe recordings showing radiatum slow gamma. Individual slow gamma troughs are marked by green triangles. (B) LFP averages triggered by slow gamma troughs (top panel), along with the averaged activity of principal cells (middle panel) and interneurons (bottom panel). Data are aggregated from 22 recording days across 10 mice. Within each recording session, the combined activity of all principal cells or all interneurons was aligned to a single slow gamma trough per theta cycle. Session averages were combined to produce the displayed grand average. (C) Average gamma phase histogram for principal cells and interneurons. Only cells significantly coupled to slow gamma (p<0.01) were included: 492 principal cells and 82 interneurons. Slow gamma mean firing phase: 176° for principal cells (99% CI: 173 – 179), and 179° for interneurons (99% CI: 172 – 185). Phase difference (principal – interneurons): -2.5° (99% CI: -9.7 – 4.2), bootstrap p = 0.345. (D-F) Same as in (A-C), but for lacunosum-moleculare mid gamma. (E) Same as in (B) using sessions with a lacunosum-moleculare tetrode (32 recording days from 13 mice). (F) Same as (C), but for mid gamma. Includes 333 principal cells and 70 interneurons significantly coupled to mid gamma. Mid gamma mean firing phase: 258° for principal cells (99% CI: 254 – 262), and 274° for interneurons (99% CI: 255 – 293). (G-I) Same as in (A-C), but for fast gamma oscillations. (G) Silicon probe recordings showing fast gamma oscillations. (H) Same analysis as in (B), but for pyramidal fast gamma, radiatum fast gamma and ripples. Pyramidal fast gamma and ripple data: 59 recording days (including both awake and sleep periods) from 20 mice. Radiatum fast gamma data: 17 recording days from 11 mice with a distal radiatum tetrode. (I) Same analysis as (C). Includes 789 principal cells and 220 interneurons significantly coupled to pyramidal fast gamma, and 112 principal cells and 42 interneurons significantly coupled to radiatum fast gamma. Pyramidal fast gamma mean firing phase: 221° for principal cells (99% CI: 219 – 224), and 243° for interneurons (99% CI: 238 – 248); phase difference (principal – interneurons): -21.8° (99% CI: -27.2 – -16.3), bootstrap p < 10-5. Radiatum fast gamma mean firing phase: 170° for principal cells (99% CI: 160 – 180), and 134° for interneurons (99% CI: 113 – 152); phase difference (principal – interneurons): 36.5° (99% CI: 13.9 – 57.5), bootstrap p = 8x10⁻⁵.
Figure 5
Figure 5. Firing behavior of CA1 principal cells in deep and superficial pyramidal sublayers.
(A) Axial profile of SWR waveforms recorded with a silicon probe (20 μm contact spacing). Left: example SWR event. Middle: average SWR waveform across all events in the session. Right: theta-nested gamma profile and the local LFPs aligned to the descending zero-crossing of pyramidal theta, for the channels indicated by arrows. (B) Classification of principal cells as deep and superficial. Left: distribution of tetrodes projected onto the linearized trajectory (as in Figure 1F). Overlaid traces represent Gaussian components from a GMM fit. Middle: SWR waveforms from tetrodes assigned to each Gaussian component. Right: mean theta-nested gamma profiles from the same tetrodes. (C) Mean instantaneous firing rate of deep and superficial pyramidal cells during theta and SWRs. Left: activity aligned to the descending zero-crossing of pyramidal theta for both populations. Right: activity aligned to the ripple power peak. (D) Theta coupling of deep and superficial pyramidal cells. Left: histograms of the mean firing phase for both populations. Right: distribution of coupling strength for each population. (E) Z-scored firing rate of deep and superficial cells, aligned to the troughs of CA1 gamma oscillations and ripples (one trough per theta cycle). Lines above each panel display the average LFP from the corresponding layer. Solid lines indicate means, shaded areas indicate 99% bootstrap confidence intervals.
Figure 6
Figure 6. Firing behavior of CA1 interneurons in radiatum and lacunosum-moleculare layers.
(A) CA1 laminar profile reconstructed from tetrode recordings. Sharp-wave and theta waveforms were recorded using independently movable tetrodes. Average waveforms from tetrodes at varying distances from the pyramidal layer are shown. Gaussian fits (from Figure 1F) are displayed on the right (solid lines denote the 99% fit areas). Units recorded within these ranges were classified as radiatum (rad) or lacunosum-moleculare (l-m) interneurons. (B) Example rad and l-m neurons. Left: broadband signals where neurons were detected. Adjacent panels show mean spike waveforms (shading denotes interquartile range). Right: SWR response and theta phase modulation for each neuron. (C-E) Rad and l-m interneurons respond to distinct upstream inputs. (C) Optic fibers and tetrodes were implanted in CA1 to monitor neuronal activity during optogenetic stimulation of CA3 or EC terminals (see Methods). (D) CA3→CA1 inputs were targeted by transducing CA3 cells with a Cre-dependent channelrhodopsin-2 (ChR2)-YFP vector in Grik4-Cre mice; EC→CA1 inputs were targeted by transducing EC cells with a CamKII-driven ChR2-YFP construct in wild-type mice (Figure S7C). Images show ChR2-YFP-labeled terminals in CA1 from CA3 (left) and EC (right). Scale bars, 100 μm. (E) Optogenetic stimulation of CA3→CA1 inputs activated 64.5% of pyramidal layer interneurons (PyrInt; 40/62) and 34.8% of rad interneurons (23/66), but no l-m cells (0/18). EC→CA1 input stimulation recruited 42.3% of l-m cells (11/26), with minimal activation of PyrInt (2/46) and no rad neuron responses (0/63). Significant responses were defined as firing rates exceeding the baseline mean by 2 standard deviations and independently confirmed with a p < 0.01 threshold in a permutation test. (F) Mean firing rate of PyrInt, rad and l-m interneurons during SWRs. (G) Theta modulation during exploration. Left: z-scored firing rates aligned to the descending zero-crossing of pyramidal theta. Right: distribution of mean theta phases. (H) Gamma modulation of rad and l-m neurons (as in Figure 4B,E). Shaded areas in panels E, F, and G denote 99% bootstrap confidence intervals across cells.
Figure 7
Figure 7. Effect of event sample size on projection variability and classification performance.
(A) We evaluated how the number of SWR events used affects the embedding projection and layer classification. All available theta cycles were used while varying the number of randomly sampled SWR events. For representative channels from the pyramidal layer, hippocampal fissure (hf), and inner molecular layer (imol), projection histograms are shown for different SWR sample sizes. Smaller sample sizes yield broader distributions, indicating that a few hundred SWR events are necessary for convergence to the average projection coordinate. (B) Quantification of projection variability and classification accuracy across mice and layers. Classification accuracy is the proportion of projections correctly assigned to the ground-truth layer using a classifier (as in Figure 1H). (C) Same as in (A) but using all available SWR events while varying the number of theta cycles. Shown are representative channels from the radiatum, mid molecular (mmol), and granular (gr) layers. (D) Same as in (B) but for theta cycle subsampling.

Similar articles

References

    1. Andersen P, editor. The hippocampus book. Oxford University Press; 2007.
    1. Eichenbaum H. A cortical–hippocampal system for declarative memory. Nat Rev Neurosci. 2000;1:41–50. - PubMed
    1. Somogyi P, Klausberger T. In: Handbook of Brain Microcircuits. Shepherd GM, Grillner S, editors. Oxford University Press; 2017. Hippocampus: Intrinsic Organization; pp. 199–216. - DOI
    1. Van Strien NM, Cappaert NLM, Witter MP. The anatomy of memory: an interactive overview of the parahippocampal–hippocampal network. Nat Rev Neurosci. 2009;10:272–282. - PubMed
    1. Buzsáki G. Neural Syntax: Cell Assemblies, Synapsembles, and Readers. Neuron. 2010;68:362–385. doi: 10.1016/j.neuron.2010.09.023. - DOI - PMC - PubMed

LinkOut - more resources