. 2025 Jun 24;44(6):115782.
doi: 10.1016/j.celrep.2025.115782. Epub 2025 Jun 4.

The transcriptome of playfulness is sex biased in the juvenile rat medial amygdala: A role for inhibitory neurons

Affiliations

The transcriptome of playfulness is sex biased in the juvenile rat medial amygdala: A role for inhibitory neurons

Ashley E Marquardt et al. Cell Rep. .

Abstract

Social play is a well-conserved, dynamic behavior known to be sexually differentiated. In most species, males play more than females, a sex difference largely driven by the medial amygdala (MeA), yet the full mechanism establishing this bias is unknown. Here, we explore "the transcriptome of playfulness" in both sexes, demonstrating that the transcriptomic profile in the juvenile rat MeA associated with playfulness is markedly distinct in males and females. Parallel single-cell RNA sequencing experiments from newborn rats suggest that inhibitory neurons drive this sex difference. Furthermore, we show that inhibitory neurons comprise the majority of play-active cells in the juvenile MeA, with males having more play-active cells than females, of which a greater proportion are GABAergic. Through integrative bioinformatic analyses, we further explore the expression, function, and cell-type specificity of key play-associated gene modules, providing valuable insight into the sex-biased mechanisms underlying this fundamental social behavior.

Keywords: CP: Cell biology; CP: Neuroscience; RNAseq; WGCNA; amygdala; medial amygdala; scRNA-seq; sex differences; social behavior; social play.


Conflict of interest statement

Declaration of interests The authors declare no competing interests.

Figures

Figure 1.
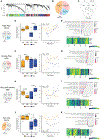
Figure 1.. Framework for bulk RNA-seq experiment
(A) Timeline of experimental procedures. (B) Quantification of cumulative number of play behaviors following 4 days of testing, used to determine high and low players for later RNA-seq, with the top third per sex designated as high playing and the bottom third per sex as low playing. Bars indicate group means, and points represent data from individual rats. *p < 0.05, n = 18 per sex.
Figure 2.
Figure 2.. The transcriptome of playfulness in the juvenile rat medial amygdala is sex biased
(A) Cluster dendrogram of the 3,436 genes used for the weighted gene co-expression network analysis (WGCNA), with each color representing one of the 22 modules identified. (B) Pie chart showing the number of bulk WGCNA modules in each category: modules associated with playfulness in females (female play), playfulness in males (male play), playfulness in both sexes (play: both sexes), or those that only showed an association with sex, not playfulness (sex only). See Figure S1 and Table S2 for graphs and statistics for all 22 modules. (C) Venn diagram showing the number of differentially expressed genes (DEGs; for nominal p < 0.05) associated with sex (male vs. female), male playfulness (“male_play”; high- vs. low-playing males), and female playfulness (“female_play”; high- vs. low-playing females). (D, F, H, and J) The majority of play-associated DEGs are sex biased. Module eigengene expression across groups (left) and in relation to cumulative play score (right; y axis is the same for both graphs) for the four representative modules bM14 (male play), bM3 (female play), bM4 (play: both sexes), and bM16 (sex only), respectively. (E, G, I, and K) Information on each representative module, including the top 10 Gene Ontology enrichments (top) and heatmaps showing expression of the top five predicted hub genes for each module across each of the 6 subjects per group (bottom). Low, low playing; High, high playing; FLO, female low playing; FHI, female high playing; MLO, male low playing; MHI, male high playing. *p < 0.05 and **p < 0.01, n = 6 per group. See also Figure S1 and Tables S1, S2, and S3.
Figure 3.
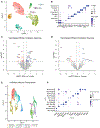
Figure 3.. Single-cell RNA-seq analysis indicates that there are more sex-biased DEGs in inhibitory neurons than excitatory neurons
(A) Uniform manifold approximation and projection (UMAP) plot identifying 9 major cell types in the neonatal amygdala of 2 male and 2 female samples, each containing pooled samples from 3 pups each. IN, inhibitory neurons; EN, excitatory neurons; OPC, oligodendrocyte precursor cells. (B) Dot plot showing the expression of marker genes used to identify the 9 major cell types. (C and D) Volcano plots showing sex-biased DEGs (male biased: log2 fold change > 0, colored in blue; female biased: log2 fold change < 0, colored in pink) within inhibitory neurons (C) and excitatory neurons (D). (E and F) Sub-clustering of the inhibitory neuron population, resulting in 11 distinct subtypes (IN.0–IN.11) (E), with the marker genes differentiating these subtypes shown in (F). See also Figures S2-S5 and Tables S4, S5, S6, and S7.
Figure 4.
Figure 4.. Integration of WGCNA analyses identifies predicted cell-type specificity and probable hub genes for selected modules
(A) Cluster dendrogram from the network reconstruction of the scRNA-seq data, using the set of 3,436 genes from the bulk-seq WGCNA as input, with each color representing one of the 25 modules identified. (B) Dot plot showing likely major cell-type identity of each of the 25 scRNA-seq modules. (C) Matrix showing the number of overlapping genes between each single-cell (scM1–scM25) and bulk-seq (bM1–bM22) module, with color indicating the −log10(p value) of a Fisher’s exact test. (D) Heatmap showing module-trait relationships (using module eigengene) across various comparisons: F = (FHI-FLO), M = (MHI-MLO), C = (MHI+FHI)/2 − (MLO +FLO)/2, HI = (MHI-FHI), LO = (MLO-FLO), CS = (MHI+MLO)/2 − (FHI+FLO)/2. (E and F) Further interrogation of the two representative intersecting module sets, including plots showing the average single-cell module eigengene across the 4 play groups (top left), association with major cell-type categories (top right), and boxplots showing expression of the 2 top-predicted candidate hub genes (bottom): those genes within the set of shared genes common to scM5 and bM14 (E) and scM7 and bM3 (F) that had the top-2 highest intramodular connectivity within the bulk-seq dataset. IN, inhibitory neurons; EN, excitatory neurons; OPC, oligodendrocyte precursor cells; FHI, female highplaying; FLO, female low playing; MHI, male high playing; MLO, male low playing. *p < 0.05, **p < 0.01, ***p < 0.001, n = 6 per group. See also Figure S6 and Tables S8, S9, S10, and S11.
Figure 5.
Figure 5.. RNAscope phenotyping of play-active cells
(A) Representative low-magnification image of Egr1 (red), Vgat (green), and Vglut2 (fuchsia) expression via fluorescent in situ hybridization (RNAscope). White dashed outline indicates the posterodorsal medial amygdala (MePD), and gridlines represent increments of 7,000 μm. (B) Representative high-magnification image of Egr1 (red), Vgat (orange), Vglut2 (fuchsia), and Cyp19a1 (green) expression alongside DAPI (blue). White dashed outline indicates the MePD, and the scale bar represents 200 μm. (C) Quantification of the number of play-active (Egr1+) cells in the male and female MePD. (D–G) The percentage of Egr1+ cells co-expressing Vgat (D) and Vglut2 (E) was also calculated, as well as the percentage of Egr1+/Vgat+ cells (F) and Vgat+ cells (G) that co-expressed Cyp19a1 (aromatase). Bars indicate group means ± SEM, and open circles represent data from individual rats. *p < 0.05; n = 6–7 per group.
Figure 6.
Figure 6.. Key module hub genes Spen and Klhdc8a are enriched in the inhibitory neuron population
(A and B) Violin plots showing log-normalized expression of Spen and Klhdc8a, respectively, across major cell types in the neonatal rat amygdala as identified in the scRNA-seq dataset. (C and D) Left, representative images of Spen (C) and Klhdc8a (D) (green), Vglut2 (red), and Vgat (fuchsia) expression via fluorescent in situ hybridization (RNAscope) alongside DAPI (blue). Scale bars represent 30 μm, and gridlines represent increments of 100 μm. Right, quantification of the percentage of Spen+ (C) and Klhdc8a+ (D) cells that co-expressed Vgat, Vglut2, or neither neuronal marker in the male and female MePD. (E and F) Left, representative images of Spen (E) and Klhdc8a (F) (green) and Egr1 (orange) expression alongside DAPI (blue). Scale bars represent 20 μm, and gridlines represent increments of 100 μm. Middle, quantification of the percentage of Egr1+ cells that co-expressed Spen (E) and Klhdc8a (F). Right, quantification of the percentage of Spen+ (E) and Klhdc8a+ (F) cells that co-expressed Egr1. Bars indicate group means ± SEM, and open circles represent data from individual rats. ***p < 0.001; n = 3–4 per group. IN, inhibitory neurons; EN, excitatory neurons; OPC, oligodendrocyte precursor cells. See also Figure S7.

Update of

Similar articles

References

    1. Hol T, Van den Berg CL, Van Ree JM, and Spruijt BM (1999). Isolation during the play period in infancy decreases adult social interactions in rats. Behav. Brain Res 100, 91–97. 10.1016/s0166-4328(98)00116-8. - DOI - PubMed
    1. van den Berg CL, Hol T, Van Ree JM, Spruijt BM, Everts H, and Koolhaas JM (1999). Play is indispensable for an adequate development of coping with social challenges in the rat. Dev. Psychobiol 34, 129–138. - PubMed
    1. Von Frijtag JC, Schot M, van den Bos R, and Spruijt BM (2002). Individual housing during the play period results in changed responses to and consequences of a psychosocial stress situation in rats. Dev. Psychobiol 41, 58–69. 10.1002/dev.10057. - DOI - PubMed
    1. Marquardt AE, VanRyzin JW, Fuquen RW, and McCarthy MM (2022). Social play experience in juvenile rats is indispensable for appropriate socio-sexual behavior in adulthood in males but not females. Front. Behav. Neurosci 16, 1076765. 10.3389/fnbeh.2022.1076765. - DOI - PMC - PubMed
    1. Einon DF, Morgan MJ, and Kibbler CC (1978). Brief periods of socialization and later behavior in the rat. Dev. Psychobiol 11, 213–225. 10.1002/dev.420110305. - DOI - PubMed

LinkOut - more resources