. 2025 Jun 6;135(15):e189920.
doi: 10.1172/JCI189920. eCollection 2025 Aug 1.

CAR-T cells targeting CD155 reduce tumor burden in preclinical models of leukemia and solid tumors

Affiliations

CAR-T cells targeting CD155 reduce tumor burden in preclinical models of leukemia and solid tumors

Tianchen Xiong et al. J Clin Invest. .

Abstract

CAR-T cells are a powerful yet expensive tool in cancer immunotherapy. Although their use in targeting hematological malignancies is well established, using a single CAR-T cell therapy to treat both hematological and solid tumors, which can reduce cost, remains largely unexplored. In this study, we identified CD155, an adhesion molecule that is upregulated during tumor progression, as a target for CAR-T cell therapy in both leukemia and solid tumors. We engineered CAR-T cells using human and mouse anti-CD155 antibodies generated from a Berkeley Lights' Beacon platform. These CAR-T cells demonstrated potent antitumor activity, significantly reducing tumor burden in preclinical models of acute myeloid leukemia, non-small cell lung cancer, and pancreatic cancer. To reduce potential allogeneic rejection, we generated CAR-T cells using humanized anti-CD155 antibody sequences that retained efficacy. Additionally, murine CAR-T cells targeting mouse CD155 exhibited limited toxic side effects in immunocompetent mice, highlighting the favorable safety profile of this therapy. These findings suggest that CD155 can be targeted by CD155 CAR-T cells safely and effectively, representing an innovative cellular therapeutic strategy that has the potential to expand its scope across both AML and multiple solid tumors, thereby lowering the cost of cellular immunotherapy, especially as allogenic, universal, and off-the-shelf CAR-T cell therapies advance to the clinic.

Keywords: Cancer immunotherapy; Oncology; Therapeutics.


Figures

Figure 1
Figure 1. CD155 is expressed on AML cell lines and primary AML samples.
(A) Representative histograms showing the expression of CD155 on AML cell lines. (B) Representative histograms (left) and statistics (right) of the percentage showing the expression of CD155 on primary AML blasts (n = 5 individual donors). (C) Representative histograms (left) and statistics of the percentage (middle) and MFI (right) showing the expression of CD155 on HSPCs from healthy donors (n = 3 individual donors) and on CD34+CD38- LSCs from patients with AML (n = 3 individual donors). Data represent the mean ± SD (B and C) and were analyzed by 2-tailed Student’s t tests (C).
Figure 2
Figure 2. CD155 CAR-T cells are functional and effectively eliminate AML cell lines in vitro.
(A) Representative flow cytometry plots (left) and statistics (right) showing the percentage of wild-type (WT) or CD155-KO MOLM13 cell death cocultured at indicated ratios with mock T or CD155 CAR-T cells for 4 hours (n = 4 individual donors). (B) Representative flow cytometry plots (left) and statistics (right) showing the percentage of WT or CD155-KO U937 cell death cocultured at indicated ratios with mock T or CD155 CAR-T cells for 4 hours (n = 4 individual donors). (C) Mock T or CD155 CAR-T cells were cultured at indicated ratios with MOLM13, U937, or THP-1 cells for 4 hours. Luciferase activity in the wells containing tumor cells was measured with a luminescence microplate reader (n = 4 individual donors). (D) Representative flow cytometry plots (left) and statistics (right) showing the percentage of IFN-γ+ and TNF+ T cells in mock T or CD155 CAR-T cells cocultured with WT or CD155-KO MOLM13 cells for 4 hours (n = 4 individual donors). (E) Representative flow cytometry plots (left) and statistics (right) showing the percentage of IFN-γ+ and TNF+ T cells in mock T or CD155 CAR-T cells cocultured with WT or CD155-KO U937 cells for 4 hours (n = 4 individual donors). IFN-γ was detected using a phycoerythrin-conjugated antibody (IFN-γ–PE), and TNF was detected using a Brilliant Violet 650–conjugated antibody (TNF-BV650) (D and E). Data represent the mean ± SD and were analyzed by 1-way ANOVA with repeated measures (D and E) or 2-way ANOVA with repeated measures (AC).
Figure 3
Figure 3. CD155 CAR-T cells exhibit potent antitumor efficacy against U937 in vivo.
(A) Diagram of the treatment scheme used for in vivo experiments. Wild-type or CD155-KO U937 cells (n = 1 × 10⁵) were i.v. injected into NSG mice, followed by an i.v. infusion of indicated number of mock T cells, CD155 CAR-T cells, or PBS (n = 5 mice/group) on day 7. (BD) Bioluminescence images (B), quantification of tumor burden (C and D), and survival curves (E) in U937 tumor-bearing mice after different treatments. Data represent the mean ± SD and were analyzed by 2-way ANOVA with repeated measures (D). For Kaplan-Meier survival curves, statistical significance was calculated with a log-rank test (E).
Figure 4
Figure 4. CD155 CAR-T cells efficiently lyse primary AML blasts in vitro and in vivo.
(A) Representative flow cytometry plots of the percentage showing CD155 expression on primary AML blasts. FSC-H (forward scatter height) was used to assess cell size. (B) Representative flow cytometry plots (left) and statistics (right) showing the percentage of primary AML blasts cell death cocultured at indicated ratios with mock T or CD155 CAR-T cells for 4 hours (n = 4 individual donors). (C) Representative flow cytometry plots (left) and statistics (right) showing the percentage of IFN-γ+ and TNF+ T cells in mock T or CD155 CAR-T cells cocultured with primary AML blasts for 4 hours (n = 4 individual donors). IFN-γ was detected using a phycoerythrin-conjugated antibody (IFN-γ–PE), and TNF was detected using a Brilliant Violet 650–conjugated antibody (TNF-BV650). (D) Diagram of the treatment scheme used for in vivo experiments. AML blasts (n = 2 × 10⁶) were i.v. injected into NSG mice, followed by an i.v. infusion of indicated number of mock T cells or CD155 CAR-T cells (n = 5 mice per group). (E) Quantitative analysis of tumor cells in peripheral blood of mice treated with mock T or CD155 CAR-T cells. (F) Survival curves of AML-bearing mice after different treatments. Data represent the mean ± SD and were analyzed by 2-way ANOVA with repeated measures (B) or 2-tailed Student’s t tests (C and E). For Kaplan-Meier survival curves, statistical significance was calculated with a log-rank test (F).
Figure 5
Figure 5. CD155 CAR-T cells show strong antitumor effects against solid tumors.
(A and B) Representative flow cytometry plots (left) and statistics (right) showing the percentage of A549 (A) or Capan-1 (B) cell death cocultured at indicated ratios with mock T or CD155 CAR-T cells for 4 hours (n = 4 individual donors). (C and D) A549 or Capan-1 cells were cultured at the indicated ratios with mock T or CD155 CAR-T cells for 72 hours. Real-time cell analysis of the cytotoxicity of mock T or CD155 CAR-T cells against A549 (C) or Capan-1 (D) tumor cells is presented as the growth index of the residual cancer cells (n = 4 individual donors). (E) Diagram of the treatment scheme used for in vivo experiments. A549 tumor cells (n = 1 × 10⁵) were i.v. injected into NSG mice, followed by an i.v. infusion of indicated number of mock T cells or CD155 CAR-T cells. Capan-1 tumor cells (n = 1 × 10⁵) were i.p. injected into NSG mice, followed by an i.p. infusion of indicated number of mock T cells or CD155 CAR-T cells. (FH) Bioluminescence images (BLIs) (F), quantification of tumor burden (G), and survival curves (H) in A549 tumor-bearing mice after different treatments (n = 5 mice per group). (IK) Bioluminescence images (I), quantification of tumor burden (J), and survival curves (K) in Capan-1 tumor-bearing mice after different treatments (n = 3 mice in mock T group; n = 4 mice in CD155 CAR-T group). Data represent the mean ± SD (A and B) and were analyzed by 2-way ANOVA with repeated measures (A, B, G, and J). For Kaplan-Meier survival curves, statistical significance was calculated with a log-rank test (H and K).
Figure 6
Figure 6. Generation and functional analysis of humanized CD155 CAR-T cells.
(A) Schematic representation of the murine anti–human CD155 antibody (B03) used in our CAR-T studies. (B) Diagram of the B03 scFv derived from the antibody in (A). (C) Diagram of the CDR engraftment process used to humanize the murine antibody B03 to Hu-B03. (D) Results of the humanness z score (σ) for the light and heavy chains of both B03 and Hu-B03 antibodies (see Methods). (E) Reduced PAGE analysis showing the migration of B03 and Hu-B03 scFvs at approximately 25 kDa. (F) Flow cytometry analysis assessing the reactivity of B03 and Hu-B03 scFvs against the HEK293T-hCD155 cell line (n = 3 replicates for each scFv). (G) Statistics showing the percentage of U937 (left) or A549 (right) cell death cocultured at indicated ratios with mock T, B03 CAR-T, or Hu-B03 CAR-T cells for 4 hours (n = 3 individual donors). (H) Bioluminescence images in U937 tumor-bearing mice (n = 3 mice per group) or A549 tumor-bearing mice (n = 3 mice in mock T group; n = 4 mice in B03/Hu-B03 CAR-T groups) after different treatments. Data represent the mean ± SD (F and G) and were analyzed by 2-way ANOVA with repeated measures (G). EC50 values were determined by fitting a nonlinear 4-parameter dose-response curve (F).
Figure 7
Figure 7. Hematopoietic safety assessment of humanized CD155 CAR-T cells.
(A) Schematic of the in vitro experimental design. A total of 5 × 10⁶ donor-matched PBMCs were cocultured with 1 × 10⁶ CellTrace Violet (CTV)-labeled CD19 CAR-T cells or Hu-B03 CAR-T cells for 12 hours (n = 4 individual donors per group). Flow cytometry–based cytotoxicity assays were performed to assess cell death across immune cell subsets. (B) Quantification of total PBMCs and specific immune subsets (T cells, B cells, NK cells, and monocytes) after coculture with CD19 CAR-T or Hu-B03 CAR-T cells. (C) Schematic of the in vivo experimental design. A total of 1 × 10⁷ PBMCs were injected into NSG mice concurrently with 2 × 10⁶ CD19 CAR-T cells or Hu-B03 CAR-T cells (n = 4 individual donors per group). Mice were sacrificed on day 7 after injection for bone marrow analysis. (D) Quantification of the frequency and absolute number of B cells, NK cells, and myeloid cells in bone marrow from treated mice. (E) Schematic of the in vivo experimental design. A total of 1 × 10⁵ CD34+ HSPCs were transplanted into NSG-SGM3 mice concurrently with the indicated number of either mock T cells or Hu-B03 CAR-T cells (n = 4 individual donors per group). Mice were sacrificed on day 30 after injection for analysis of human CD34+ HSPCs and their differentiation, including mature lymphoid and myeloid populations in the bone marrow. (F) Quantification of human CD34+ HSPCs, CD19+ B cells, CD56+ NK cells, and CD11c+ DCs in bone marrow from mice treated with mock T cells or Hu-B03 CAR-T cells. Data represent the mean ± SD and were analyzed by paired 2-tailed Student’s t tests (B, D, and F).
Figure 8
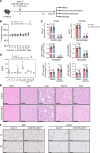
Figure 8. mCD155 CAR-T cells show a favorable systemic and neurotoxic safety profile in immunocompetent mouse models.
(A) Treatment schedule for in vivo toxicity assessment of mCD155 CAR-T cells in a syngeneic immunocompetent mouse model. (B) Weight change of mice injected with mock T or mCD155 CAR-T cells (n = 5 mice per group). (C) Statistics of absolute cell numbers of CD19+ B cells, NK1.1+ NK cells, CD11c+MHC-II+ DCs, CD11b+F4/80+ macrophages, CD11b+Ly6C+ monocytes, and CD11b+Ly6G+ neutrophils in the spleen and bone marrow of mice on day 30 after injection with mock T or mCD155 CAR-T cells (n = 5 mice per group). (D) Assessment of serum cytokine levels from mice described in (C). (E) H&E staining of the organs collected from mice described in (C). Scale bars: 100 μm. (F) IHC analysis of IBA1 (left) and GFAP (right) expression on brain tissues from mice described in (C). Scale bars: 100 μm. Data represent the mean ± SD and were analyzed by 2-way ANOVA with repeated measures (B) or 2-tailed Student’s t tests (C and D).

References

    1. Maude SL, et al. Chimeric antigen receptor T cells for sustained remissions in leukemia. N Engl J Med. 2014;371(16):1507–1517. doi: 10.1056/NEJMoa1407222. - DOI - PMC - PubMed
    1. Maude SL, et al. Tisagenlecleucel in children and young adults with B-cell lymphoblastic leukemia. N Engl J Med. 2018;378(5):439–448. doi: 10.1056/NEJMoa1709866. - DOI - PMC - PubMed
    1. Neelapu SS, et al. Axicabtagene ciloleucel CAR T-cell therapy in refractory large B-cell lymphoma. N Engl J Med. 2017;377(26):2531–2544. doi: 10.1056/NEJMoa1707447. - DOI - PMC - PubMed
    1. Schuster SJ, et al. Tisagenlecleucel in adult relapsed or refractory diffuse large B-cell lymphoma. N Engl J Med. 2019;380(1):45–56. doi: 10.1056/NEJMoa1804980. - DOI - PubMed
    1. Daver N, et al. T-cell-based immunotherapy of acute myeloid leukemia: current concepts and future developments. Leukemia. 2021;35(7):1843–1863. doi: 10.1038/s41375-021-01253-x. - DOI - PMC - PubMed

MeSH terms