

Visual feature analysis on selective appetite in individuals with autism spectrum disorders
- PMID: 40478848
- PMCID: PMC12143564
- DOI: 10.1371/journal.pone.0325416
Visual feature analysis on selective appetite in individuals with autism spectrum disorders
Abstract
Background: Individuals with autism spectrum disorders (ASD) experience more severe selective eating problems than their neurotypical peers. Identifying the causes of selective eating behavior poses a considerable challenge, even for caregivers. Accurate identification of the underlying causes of this behavior is essential for developing interventions aimed at overcoming dysfunctional, unbalanced diets. However, studies that meticulously identify the causes of selective eating behaviors are scarce. This investigation aims to explore the differences in preferences for sunny-side-up eggs between individuals with ASD and those with typical development (TD), focusing on the factors influencing their likes and dislikes through a systematic analysis of visual features.
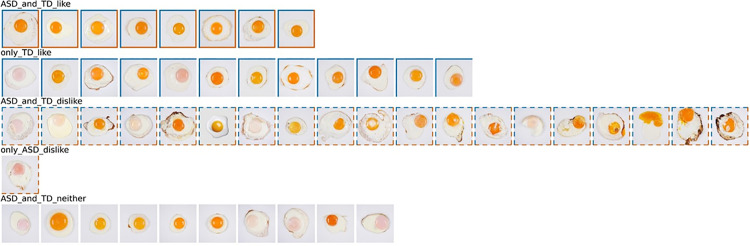
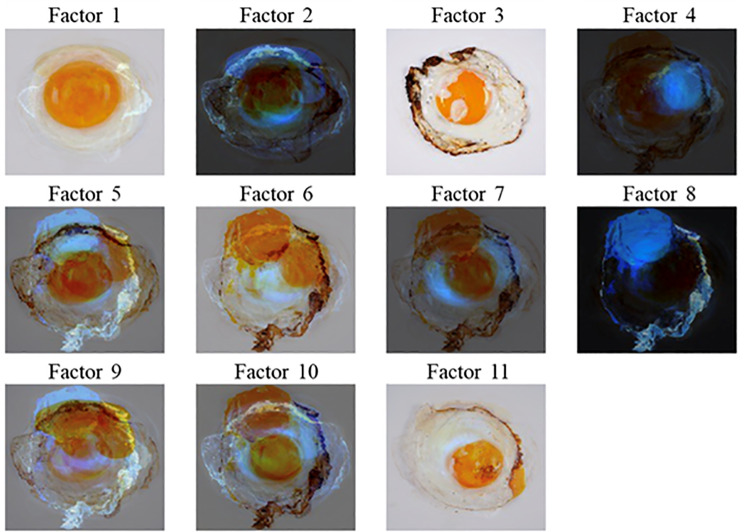
Method: Thirty-nine individuals with ASD (mean age, 23.4 ± 4.7 years; 82% men) and fifty individuals with TD (mean age, 22.2 ± 1.3 years; 64% men) participated in this study. We used a total of 50 images of sunny-side-up eggs as visual stimuli. Using Non-negative Matrix Factorization and Decision Tree analysis, factors associated with visual preferences for sunny-side-up eggs were identified.
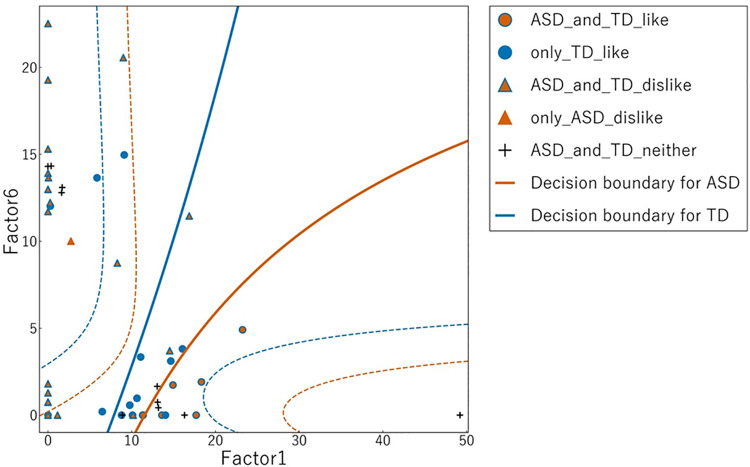
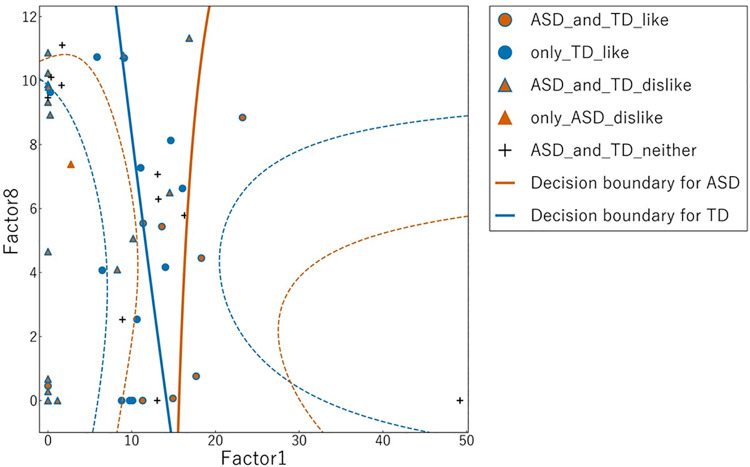
Data and results: We could identify factors associated with visual preferences for sunny-side-up eggs. Subsequent linear regression analysis provided insight into how these visual features delineate preference boundaries between liked and disliked foods, with noteworthy distinctions emerging between the ASD and TD groups.
Conclusions: This study provides novel insights into the visual determinants of food preferences in individuals with ASD through systematic analysis of image features. Our findings indicated the potential to predict preferences while elucidating the causes of selective eating behaviors, thereby offering solutions for individuals with ASD.
Copyright: © 2025 Terada et al. This is an open access article distributed under the terms of the Creative Commons Attribution License, which permits unrestricted use, distribution, and reproduction in any medium, provided the original author and source are credited.
Conflict of interest statement
The authors report no conflicts of interest.
Figures

Similar articles
-
Largely Typical Electrophysiological Affective Responses to Special Interest Stimuli in Adolescents with Autism Spectrum Disorder.J Autism Dev Disord. 2018 Sep;48(9):3133-3143. doi: 10.1007/s10803-018-3587-9. J Autism Dev Disord. 2018. PMID: 29680961
-
Heterogeneity of Visual Preferences for Biological and Repetitive Movements in Children With Autism Spectrum Disorder.Autism Res. 2021 Jan;14(1):102-111. doi: 10.1002/aur.2366. Epub 2020 Sep 21. Autism Res. 2021. PMID: 32954673 Clinical Trial.
-
Dietary Patterns and Weight Status in Italian Preschoolers with Autism Spectrum Disorder and Typically Developing Children.Nutrients. 2021 Nov 12;13(11):4039. doi: 10.3390/nu13114039. Nutrients. 2021. PMID: 34836294 Free PMC article.
-
Food selectivity and neophobia in children with autism spectrum disorder and neurotypical development: a systematic review.Nutr Rev. 2023 Jul 10;81(8):1034-1050. doi: 10.1093/nutrit/nuac112. Nutr Rev. 2023. PMID: 36633300
-
Programmes to manage food selectivity in individuals with autism spectrum disorder.Nutr Res Rev. 2025 Jun;38(1):112-125. doi: 10.1017/S0954422424000052. Epub 2024 Feb 22. Nutr Res Rev. 2025. PMID: 38385245 Review.
References
-
- American Psychiatric Association (APA). Diagnostic and statistical manual of mental disorders. 5th ed. ed. Arlington, VA: American Psychiatric Publishing; 2013. 5–25.
-
- Turner MA. Generating novel ideas: fluency performance in high-functioning and learning disabled individuals with autism. J Child Psychol Psychiatry. 1999;40(2):189–201. - PubMed
MeSH terms
LinkOut - more resources
Full Text Sources
Medical
