. 2025 Jun 6;10(108):eadr7057.
doi: 10.1126/sciimmunol.adr7057. Epub 2025 Jun 6.

Inducible protein degradation reveals inflammation-dependent function of the Treg cell lineage-defining transcription factor Foxp3

Affiliations

Inducible protein degradation reveals inflammation-dependent function of the Treg cell lineage-defining transcription factor Foxp3

Christina Jäger et al. Sci Immunol. .

Abstract

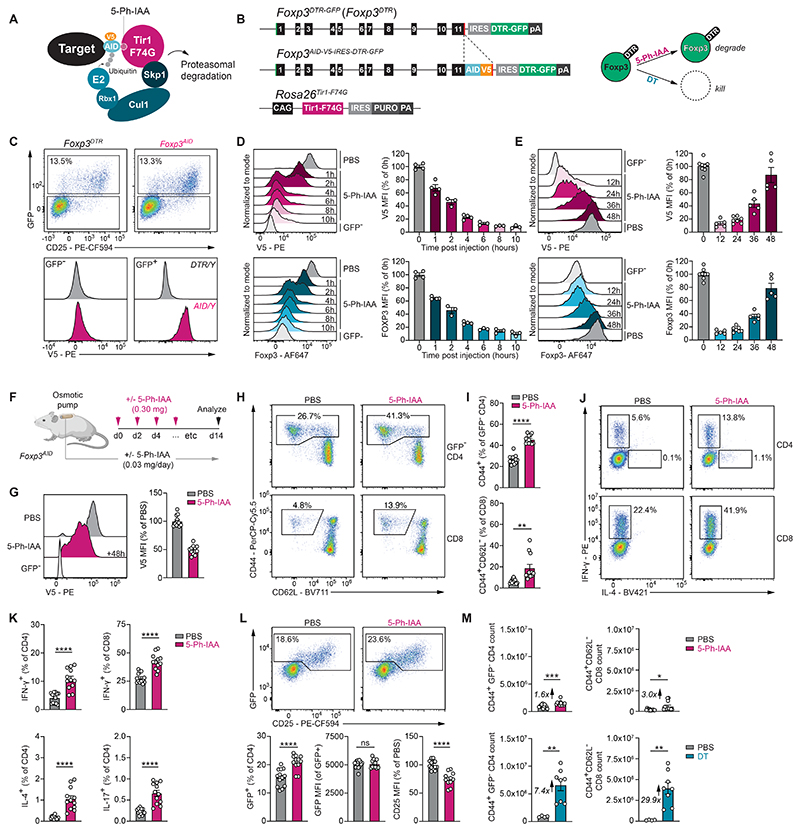
Regulatory T cells (Treg cells) are immunosuppressive CD4 T cells defined by expression of the transcription factor Foxp3. Genetic loss-of-function mutations in Foxp3 cause lethal multiorgan autoimmune inflammation resulting from defects in Treg cell development and suppressive activity. Whether Treg cells are continuously dependent on Foxp3 is still unclear. Here, we leveraged chemically induced protein degradation to show that functionally suppressive Treg cells in healthy organs can persist in the near-complete absence of Foxp3 protein for at least 10 days. Conversely, Treg cells responding to type 1 inflammation in settings of autoimmunity, viral infection, or cancer were selectively lost upon Foxp3 protein depletion. Acute degradation experiments revealed that Foxp3 acts mostly as a direct transcriptional repressor and modulates responsiveness to cytokine stimulation. This inflammation-dependent requirement for continuous Foxp3 activity enabled induction of a selective antitumor immune response upon systemic Foxp3 depletion, without causing deleterious T cell expansion in healthy organs.


Conflict of interest statement

Competing interests: The institution that A.O. is affiliated with has received fees for her participation on an advisory board or for presentation at a company-sponsored symposium from Genentech, Roche, InvIOs, AstraZeneca, and Boehringer Ingelheim. All other authors declare that they have no competing interests.

Figures

Fig. 1
Fig. 1. Chemically-induced degradation of Foxp3.
(A) Schematic illustration of the AID2 system. (B) Schematic illustration of the Foxp3AID-V5-IRES-DTR-GFP and Rosa26Tir1-F74G alleles and their function. (C) Representative flow cytometry plots showing GFP fluorescence and V5 staining in the spleen. (D) Flow cytometry measurements of Foxp3 degradation kinetics following i.p. injection of 5-Ph-IAA. Geometric mean fluorescence intensity (MFI) of V5 or Foxp3 intracellular antibody staining in GFP+ TREG cells was normalized to the average of PBS-treated control samples after subtracting background fluorescence from the GFP- CD4 T cell population. Pooled data from two independent experiments a total of 3 to 4 mice per timepoint. (E) Foxp3 protein recovery after 5-Ph-IAA injection. Pooled data from three independent experiments with 5-8 mice per timepoint (F) Experimental setup. Osmotic pumps delivering ∼0.03 mg/day 5-Ph-IAA or PBS were implanted into male and female Foxp3AID mice. 0.3 mg 5-Ph-IAA or PBS was injected every 48 hours for 14 days. (G) Foxp3-V5 levels 48 hours after the final 5-Ph-IAA injection. (H-I) Flow cytometry analysis of CD44 and CD62L on splenic CD4 and CD8 T cells after 14 days of continuous 5-Ph-IAA treatment. (J-K) Cytokine production measured by intracellular staining and flow cytometry. (L) GFP and CD25 levels on splenic CD4 T cells following 14-day continuous Foxp3 protein depletion. (M) Total activated GFP- CD4 and CD8 T cell counts after 14 days of Foxp3 protein degradation (top) or 11 days after two consecutive daily injections of DT (bottom). Panels G-M show pooled data from three independent experiments with 12-13 mice per group (Foxp3 degradation) or pooled data from two independent experiments with 4-8 mice per group (TREG cell depletion). Error bars show mean with SEM. P values were calculated using unpaired two-tailed Student’s t-test. ns: P > 0.05, *: P ≤ 0.05, **: P ≤ 0.01, ***: P ≤ 0.001, ****: P ≤ 0.0001.
Fig. 2
Fig. 2. Proliferative non-lymphoid tissue TREG cells persist following short-term Foxp3 depletion.
(A-B) Male and female Foxp3AID mice were injected with 5-Ph-IAA or PBS for 10 consecutive days. An eFluor450-labeled antibody against CD45 was injected intravenously (i.v.) 3 minutes before euthanizing the animals to distinguish vascular-associated (i.v. CD45+) and tissue-associated (i.v. CD45-) immune cells. Foxp3 (V5) protein levels were measured in GFP+ CD4 T cells from spleen, liver, lung, and large intestine lamina propria (LI). GFP- CD4 T cells are shown as a negative control. (C-D) Flow cytometry data showing Ki-67 staining on GFP+ CD4 T cells. (E) Frequency of GFP+ cells among CD4 T cells in indicated organs. (F) GFP geometric mean fluorescence intensity (MFI) among GFP+ CD4 T cells. (G) CD25 levels on GFP+ TREG cells, normalized to PBS-treated controls. (H) GFP- CD4 and CD8 T cell counts across different organs after 10 days of continuous Foxp3 protein depletion. Panels A-H show pooled data from 2 independent experiments with a total of 6-8 mice per group. (I) Foxp3AID mice were injected with diphtheria toxin (DT) on day 0, 1, and 6. GFP+ CD4 T cell frequencies and GFP- CD4 and CD8 T cell counts analyzed on days 10-12. Pooled data from 2 independent experiments with a total of 6 mice per group. Error bars show mean with SEM. P values were calculated using unpaired two-tailed Student’s t-test. *: P ≤ 0.05, **: P ≤ 0.01, ***: P ≤ 0.001, ****: P ≤ 0.0001.
Fig. 3
Fig. 3. Acutely activated TREG cells require Foxp3.
(A) Experimental setup. (B) Representative CD45 staining on splenic CD4 T cells and summary data showing percentage of CD45.2+ CD4 T cells. (C-D) V5, GFP, and CD25 levels on splenic CD45.2+ CD4 T cell populations. Panels A-D show pooled data from two independent experiments with 6-7 mice per group. (E) Experimental setup. (F) Splenic effector CD4 and CD8 T cell frequencies on day 12. Pooled data from 4 independent experiments with 14-20 mice per group (G-H) GFP+ and V5+ cell frequencies among splenic CD4 T cells and GFP MFI on day 12. Panel H shows pooled data from three independent experiments with 13-16 mice per group. (I-J) GFP and CXCR3 staining on CD4 T cells on day 12. Pooled data from two independent experiments with a total of 8-9 mice per group. (K) Experimental setup. Foxp3AID mice were infected with 2x10⁵ pfu LCMV Armstrong (LCMV Arm.). Foxp3 protein was depleted from day 5 onwards through daily injections of 5-Ph-IAA. (L-M) GFP and CXCR3 staining on splenic CD4 T cells on day 12 post-infection. Pooled data from two independent experiments with 7-10 mice per group. Error bars show mean with SEM. P values were calculated using unpaired two-tailed Student’s t-tests (D, H) or one-way ANOVA with Tukey’s multiple comparisons test (F, J, M). ns: P > 0.05, *: P ≤ 0.05, **: P ≤ 0.01, ***: P ≤ 0.001, ****: P ≤ 0.0001.
Fig. 4
Fig. 4. Immediate transcriptional functions of Foxp3 in activated TREG cells
(A) Experimental setup. (B-C) Differential gene expression analysis in steady-state (left) or activated (right) GFP+ CD4 T cells from pooled secondary lymphoid tissues of animals treated with 5-Ph-IAA or PBS for 6 hours. Analysis of intronic (top) and exonic (bottom) reads. Genes with adjusted P <0.01 are highlighted. RNA-sequencing samples were pooled from 7 independent sorts, with a total of 6-10 biological replicates per condition. (D-E) Expression of selected genes in transcripts per million (TPM). (F) Each cell shows the number of upregulated (top) and downregulated (bottom) genes at a given P value and fold change (FC) cutoff. Cells are colored according to the ratio of up- and downregulated genes. (G) Gene Ontology (GO) term enrichment analysis for differentially expressed (DE) genes (top). Each dot represents a GO term. Dot size reflects statistical significance of the enrichment. Upregulated genes associated with GO term lymphocyte activation (bottom). (H) DE genes identified in activated TREG cells were linked to Foxp3 binding sites identified by ChIP-seq, CUT&RUN, the intersection of peaks identified by both techniques or the intersection of the top 2000 most highly bound sites identified by both techniques using public data from GSE154680. (I) Model for activation-dependent gene regulation by Foxp3. (J) Differential gene expression between activated TREG (aTreg) cells and resting TREG (rTreg) cells, measured in the presence (PBS) or absence (5-Ph-IAA) of Foxp3 protein. Analysis was performed for three gene sets: all expressed genes (all genes), genes upregulated after Foxp3 degradation in activated TREG cells (Up genes) and genes downregulated after Foxp3 degradation in activated TREG cells (Down genes). P values from hypergeometric test (H) or one-sided Kolmogorov-Smirnov test (J).
Fig. 5
Fig. 5. Cytokines dictate the effects of Foxp3 depletion.
(A) Experimental setup. FACS-sorted GFP+ TREG or GFP- naïve TCON CD4 T cells were isolated from pooled secondary lymphoid tissues of Foxp3AID mice and activated in vitro on anti-CD3-coated plates with anti-CD28 and IL-2. 5-Ph-IAA and TH1-polarizing cytokines (IFN-γ and IL-12) were added to the cultures 48 hours post-activation, as indicated. (B-D) Flow cytometry analysis of GFP, Foxp3, T-bet, and IFN-γ levels. TCON cells activated in the presence or absence of TH1-polarizing cytokines are gated on GFP- CD4 T cells. TREG cells are gated on GFP+ CD4 T cells. Cytokine production was measured after 3-hours of restimulation with PMA/Ionomycin/Brefeldin A/Monensin. T-bet levels are normalized to the positive control population (TCON + IFN-γ/IL-12) after subtracting background fluorescence. Pooled data from 4 independent experiments with a total of 3-6 biological replicates per group. (E) Experimental design. (F) GFP and CD25 levels on splenic CD4 T cells of the indicated treatment groups. (G-J) Summary data showing Foxp3 (V5) and CD25 levels on splenic GFP+ CD4 T cells and the percentage of GFP+ cells among CD4 T cells. V5 levels are normalized to the average of their respective negative control groups that did not receive 5-Ph-IAA. Pooled data from three independent experiments with a total of 6-9 mice per group. Error bars show mean with SEM. P values were calculated using one-way ANOVA with Tukey’s multiple comparisons test. ns: P > 0.05, *: P ≤ 0.05, **: P ≤ 0.01, ***: P ≤ 0.001, ****: P ≤ 0.0001.
Fig. 6
Fig. 6. Short-term Foxp3 depletion drives localized anti-tumor immunity.
A) Experimental setup. 1x10⁶ MC38 tumor cells were subcutaneously (s.c.) injected into the right flank of Foxp3AID mice, which were subsequently treated with PBS, DT, or 5-Ph-IAA as indicated. Animals were analyzed on day 12 (experiment 2) or day 13 (experiment 1), when tumors from PBS-treated animals reached a critical size. B) Tumor volume measurements at indicated timepoints. C) Tumor weight at the end of the experiment. D) Spleen weight and effector T cell counts in the spleen at the end of the experiment. E-F) GFP and CD25 levels on CD4 T cells from the spleen, non-draining brachial and axillary lymph nodes (ndLN), draining brachial and axillary lymph nodes (dLN), or the tumor. G) Effector CD4 and CD8 T cell counts in the indicated organs. H-I) CD25 and Ki-67 staining on effector CD4 and CD8 T cells from the indicated organs. Pooled data from two independent experiments with 10-12 mice per experimental group. P values from one-way ANOVA with Tukey’s multiple comparisons test (C-D), or two-tailed unpaired (F) or paired (G, I) Student’s t-tests. ns: P > 0.05, *: P ≤ 0.05, **: P ≤ 0.01, ***: P ≤ 0.001, ****: P ≤ 0.0001.

Similar articles

References

    1. Josefowicz SZ, Lu LF, Rudensky AY. Regulatory T cells: mechanisms of differentiation and function. Annu Rev Immunol. 2012;30:531–564. doi: 10.1146/annurev.immunol.25.022106.141623. - DOI - PMC - PubMed
    1. Bos PD, Plitas G, Rudra D, Lee SY, Rudensky AY. Transient regulatory T cell ablation deters oncogene-driven breast cancer and enhances radiotherapy. J Exp Med. 2013;210:2435–2466. doi: 10.1084/jem.20130762. - DOI - PMC - PubMed
    1. Kim JM, Rasmussen JP, Rudensky AY. Regulatory T cells prevent catastrophic autoimmunity throughout the lifespan of mice. Nat Immunol. 2007;8:191–197. - PubMed
    1. Klages K, et al. Selective depletion of Foxp3+ regulatory T cells improves effective therapeutic vaccination against established melanoma. Cancer Res. 2010;70:7788–7799. - PubMed
    1. Lahl K, et al. Selective depletion of Foxp3+ regulatory T cells induces a scurfy-like disease. J Exp Med. 2007;204:57–63. doi: 10.1084/jem.20061852. - DOI - PMC - PubMed

Publication types

Substances