. 2025 Jun 6;11(23):eadt6683.
doi: 10.1126/sciadv.adt6683. Epub 2025 Jun 6.

Rapid and reversible fluorescent probe enables repeated snapshot imaging of AMPA receptors during synaptic plasticity

Affiliations

Rapid and reversible fluorescent probe enables repeated snapshot imaging of AMPA receptors during synaptic plasticity

Kyohei Soga et al. Sci Adv. .

Abstract

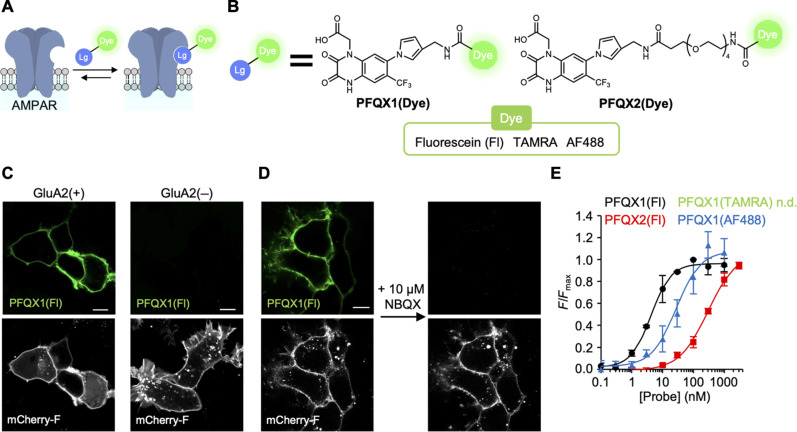
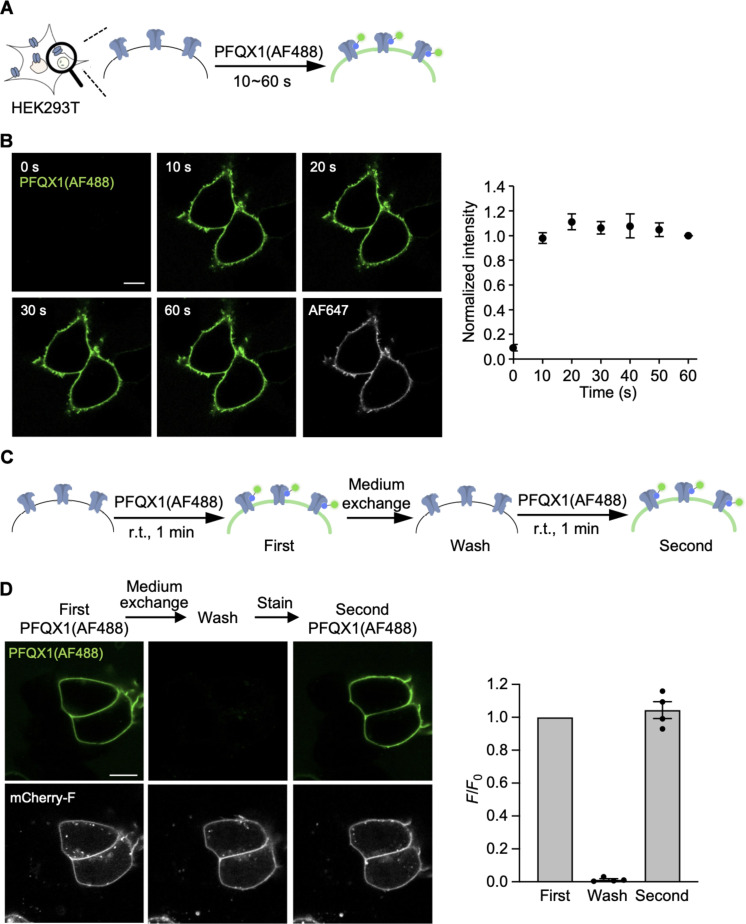
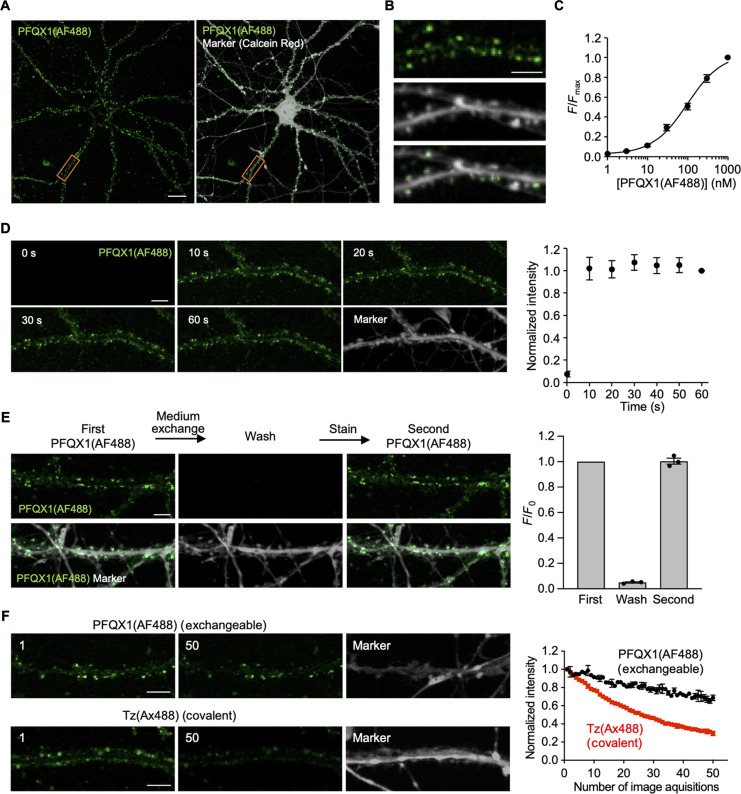
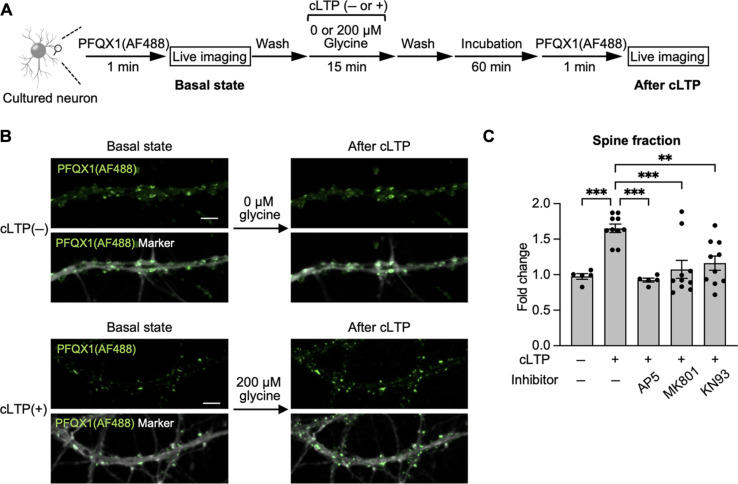
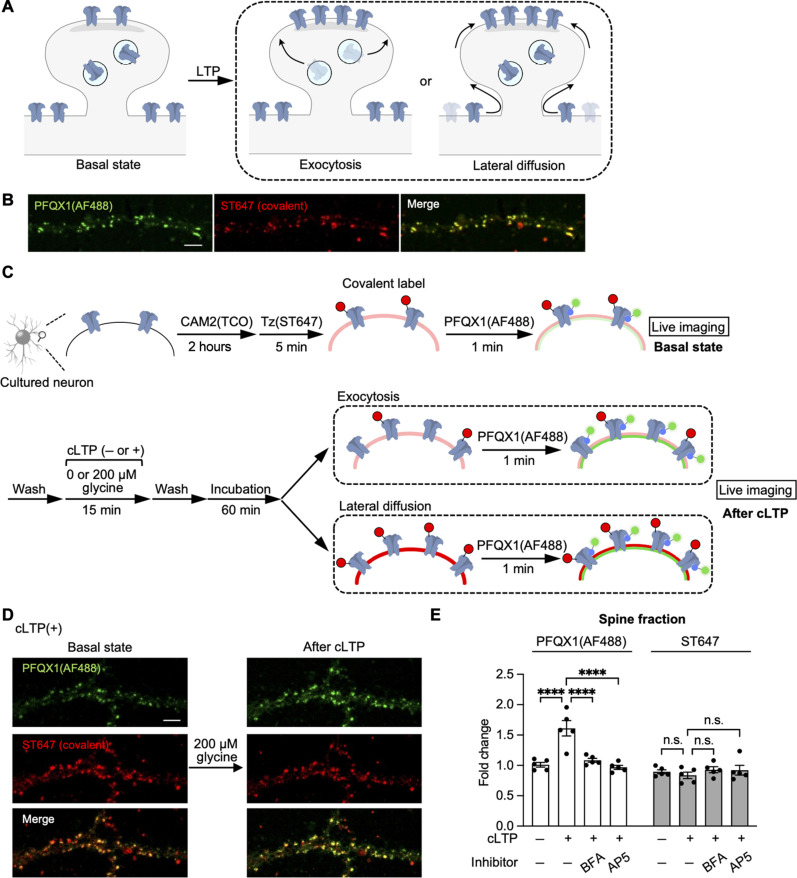
The subcellular localization of neurotransmitter receptors is strictly regulated in neurons. Changes in the trafficking of α-amino-3-hydroxy-5-methyl-4-isoxazolepropionic acid (AMPA)-type glutamate receptors (AMPARs) play an essential role in synaptic plasticity, which is the cellular basis of learning and memory. To explore receptor trafficking, genetically encoded approaches (e.g., the fusion of fluorescent proteins to receptors) are often used. However, concerns remain that genetic approaches cannot fully reproduce the receptor functions that are inherent to neurons. Herein, we report on PFQX1(AF488), a fluorescent probe for the visualization of cell-surface AMPARs without any genetic manipulation to neurons. The rapid and reversible staining features of this probe enabled snapshot imaging, which showed the accumulation of native AMPARs in dendritic spines during synaptic plasticity. Moreover, the mechanism of this synaptic accumulation, for which genetically encoded approaches have given controversial results, was revealed by integrating two chemical methods: PFQX1(AF488) and covalent chemical labeling.


Figures

Fig. 1.
Fig. 1.. Development of fluorophore-ligand conjugates for AMPARs.
(A) Schematic illustration of AMPAR staining with fluorophore-ligand conjugates. Lg, AMPAR ligand; Dye, fluorescent dye. (B) Chemical structures of fluorophore-ligand conjugates. See fig. S2 for detailed chemical structures. (C) Confocal live images of HEK293T cells transfected with GluA2 [GluA2(+)] or its control vector [GluA2(−)]. The cells were treated with 100 nM PFQX1(Fl). mCherry-F was used as a transfection marker. Scale bars, 10 μm. (D) Competitive inhibition of PFQX1(Fl) binding by NBQX. PFQX1(Fl) (100 nM) was added to the HEK293T cells expressed with GluA2. Then, 10 μM NBQX was added to the medium. Scale bar, 10 μm. (E) Concentration-dependent binding of fluorophore-ligand conjugates to GluA2 (n = 3). See fig. S3A for detailed results. Data are represented as means ± SEM. n.d., not determined.
Fig. 2.
Fig. 2.. Structure of the S1S2J complexed with PFQX1(AF488).
The residue numbers of S1S2J are shown, and the corresponding residue of full-length GluA2 is also shown in parentheses. (A) The overall structure of the S1S2J bound to PFQX1(AF488) is displayed as a ribbon diagram. The electron density of bound PFQX1(AF488) (gray) was shown as the polder map at a contoured level of 3.0σ. (B) Interaction manner of the PFQX1(AF488). The PFQX and AF488 parts of the PFQX1(AF488) are highlighted in orange and green, respectively. The residues and waters contacted to the PFQX and AF488 are also shown in orange and green. The interacting residues in the symmetry mate are colored in black. Polar and hydrophobic interactions are shown as dotted lines (black) and solid lines (gray), respectively. (C) Contacts between the PFQX part and S1S2J. The residues interacted with the PFQX part are shown as sticks (orange). The polder map of the PFQX1(AF488) is shown at 3.0σ. (D) Adaptive Poisson-Boltzmann Solver (APBS)-generated electrostatic potential of the S1S2J. A positively charged surface around the AF488 is extended. Right: Close-up view of the ligand binding site, and the residues involved in recognizing the AF488 part are shown as sticks (green).
Fig. 3.
Fig. 3.. Rapid and reversible staining of AMPARs in HEK293T cells.
(A) Experimental procedure to analyze the time course of PFQX1(AF488) binding to GluA2 on live cells. The fluorescent images were obtained at specified time points after the addition of 100 nM PFQX1(AF488) by confocal microscopy. (B) Left: Representative confocal live images of HEK293T cells expressing Halo-tag-fused GluA2 on the N terminus after the addition of 100 nM PFQX1(AF488). Halo-tag ligand AF647 was used as a transfection marker. Right: The surface intensity of AF488 was quantified, which was normalized to the intensity at 60 s (n = 3). Scale bar, 10 μm. (C) Experimental procedure to analyze the reversibility of PFQX1(AF488) binding to GluA2. First image was obtained 1 min after addition of 100 nM PFQX1(AF488) to the culture medium. A wash image was obtained after the medium exchange. Then, 100 nM PFQX1(AF488) was re-treated to obtain the second image. r.t., room temperature. (D) Left: Representative confocal live cell imaging of HEK293T cells expressed with GluA2 to analyze the reversibility of PFQX1(AF488) binding. mCherry-F was used as a transfection marker. Right: The surface intensity of AF488 was quantified, which was normalized to the first images (n = 4). Scale bar, 10 μm. Data are represented as means ± SEM.
Fig. 4.
Fig. 4.. Visualization of native AMPARs in cultured hippocampal neurons.
(A and B) Confocal live images of cultured hippocampal neurons treated with 100 nM PFQX1(AF488). Calcein red signals are shown in gray as a cytoplasmic marker. Orange ROIs indicated in (A) are expanded in (B). Scale bars, 20 μm in (A) and 5 μm in (B). (C) Concentration dependency of PFQX1(AF488) binding to AMPARs in cultured hippocampal neurons (n = 3). The Kd value was 97.5 ± 9.9 nM. (D) Time course of PFQX1(AF488) binding. The cells were treated with 100 nM PFQX1(AF488), and images were obtained at specified time points by confocal microscopy. Left: Representative confocal live images of cultured hippocampal neurons after the addition of 100 nM PFQX1(AF488). Right: The intensity of PFQX1(AF488) in spines was quantified, which was normalized to the intensity at 60 s (n = 3). Scale bar, 5 μm. (E) Reversibility of PFQX1(AF488) binding to AMPARs. Left: Representative confocal live imaging of cultured hippocampal neurons. Right, the intensity of PFQX1(AF488) in spines was quantified, which was normalized to the first images. [PFQX1(AF488)] = 100 nM (n = 3). Scale bar, 5 μm. (F) Repeated confocal imaging of cultured hippocampal neurons. Left: Representative images. The number of repeated acquisitions is indicated in the images. Right, the intensity of AF488 in spines was analyzed and normalized to the intensity in the first image (n = 3). [PFQX1(AF488)] = 30 nM. Scale bars, 5 μm. Data are represented as means ± SEM.
Fig. 5.
Fig. 5.. Visualization of the surface accumulation of AMPARs by cLTP stimulation.
(A) Experimental scheme of cLTP stimulation. “Basal state” images were obtained after the addition of 100 nM PFQX1(AF488) to cultured hippocampal neurons. The probe was washed out by medium exchange. Then, cLTP was induced in cLTP stimulation buffer containing 200 μM glycine at room temperature for 15 min. After medium exchange with cLTP incubation buffer, the cells were further incubated for 60 min. Then, the cells were treated again with 100 nM PFQX1(AF488) to obtain “after cLTP” images. (B) Representative images of the cLTP experiment. Top: Images of the control condition “cLTP(−)” where glycine was not added to the cells are shown. Bottom: Images of the cells stimulated with glycine, “cLTP(+)”, are shown. Calcein red signals are shown in gray as a cytoplasmic marker. Scale bars, 5 μm. (C) The intensity of PFQX1(AF488) in spines was analyzed by the intensity of “after cLTP” images divided by that of “basal state” images. [AP5] = 50 μM, [MK-801] = 20 μM, and [KN93] = 5 μM (n = 5 to 10). Significant difference (**P < 0.01; ***P < 0.001, one-way ANOVA with Dunnett’s test). Data are represented as means ± SEM.
Fig. 6.
Fig. 6.. Mechanisms of the surface accumulation of AMPARs by cLTP stimulation.
(A) Putative mechanisms of AMPAR accumulation in synapses during LTP. (B) Confocal live imaging of cultured hippocampal neurons. The cells were treated with 2 μM CAM2(TCO) for 2 hours, followed by the addition of 100 nM Tz(ST647) for 5 min. Then, 100 nM PFQX1(AF488) was added to the cells. A detailed scheme of two-step labeling of ST647 is shown in fig. S14A. Scale bar, 5 μm. (C) A schematic illustration of the experimental procedure for discriminating between exocytosis or lateral diffusion is shown. Cultured hippocampal neurons were covalently labeled with 2 μM CAM2(TCO) for 2 hours followed by 100 nM Tz(ST647) for 5 min. “Basal state” images were scanned after the addition of 100 nM PFQX1(AF488). After washing out of PFQX1(AF488) by medium exchange, cLTP was induced by 200 μM glycine for 15 min, and the cells were further incubated for 60 min in cLTP incubation buffer. The cells were treated with 100 nM PFQX1(AF488) again to obtain “after cLTP” images. A schematic illustration of putative results regarding ST647 labeling is also shown in fig. S14C. (D) Representative live cell images of the cLTP experiment. Images of the cells stimulated with glycine are shown. Scale bar, 5 μm. (E) The intensity of AF488 and ST647 in spines was analyzed. Fluorescence intensity of “after cLTP” images was divided by that of “basal state” images. Raw images for cLTP(−), brefeldin A (BFA) pretreatment, and AP5 pretreatment are shown in figs. S14D and S15 (B and C), respectively. [AP5] = 50 μM, [BFA] = 25 μM (n = 5). Significant difference (****P < 0.0001). n.s., not significant (P > 0.05, two-way ANOVA with Tukey’s test). Data are represented as means ± SEM.

Similar articles

References

    1. Bliss T. V., Collingridge G. L., A synaptic model of memory: Long-term potentiation in the hippocampus. Nature 361, 31–39 (1993). - PubMed
    1. Martin S. J., Grimwood P. D., Morris R. G., Synaptic plasticity and memory: An evaluation of the hypothesis. Annu. Rev. Neurosci. 23, 649–711 (2000). - PubMed
    1. Citri A., Malenka R. C., Synaptic plasticity: Multiple forms, functions, and mechanisms. Neuropsychopharmacology 33, 18–41 (2008). - PubMed
    1. Bredt D. S., Nicoll R. A., AMPA receptor trafficking at excitatory synapses. Neuron 40, 361–379 (2003). - PubMed
    1. Huganir R. L., Nicoll R. A., AMPARs and synaptic plasticity: The last 25 years. Neuron 80, 704–717 (2013). - PMC - PubMed

LinkOut - more resources