Satellites reveal hot spots of ocean changes in the early 21st century
- PMID: 40479069
- PMCID: PMC12143372
- DOI: 10.1126/sciadv.ads0307
Satellites reveal hot spots of ocean changes in the early 21st century
Abstract
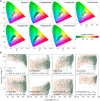
Ocean change leaves a potentially important imprint on ocean colorimetry. Here, we present an overview and current evaluation of the global ocean color variability from 1998 to 2022, and satellites observe that 36% of oceans (~122 million square kilometers, derived from valid observations) have experienced changes (P < 0.1). In this context, 25% of the area (formerly blue hue) is turning light blue or green, while the remaining 11% becomes bluer, mainly concentrating in the low-latitude oceans. This study further identifies a "direct" notable impact of both sea surface temperature (SST) and climate on ocean colorimetry tendency and anomaly, especially in the low-latitude oceans. Extreme SST events cause "distinct" ocean colorimetry anomalies, although 94% of cases involve relatively small SST fluctuations. Causal analysis reveals important impacts of climate change on equatorial ocean dynamics, particularly ENSO events. Our findings prove the low-latitude oceans as one of the core changing regions that respond to climate change in the early 21st century.
Figures


Similar articles
-
Fingerprints of El Niño Southern Oscillation on global and regional oceanic chlorophyll-a timeseries (1997-2022).Sci Total Environ. 2024 Dec 10;955:176893. doi: 10.1016/j.scitotenv.2024.176893. Epub 2024 Oct 16. Sci Total Environ. 2024. PMID: 39419220
-
Increased variability of eastern Pacific El Niño under greenhouse warming.Nature. 2018 Dec;564(7735):201-206. doi: 10.1038/s41586-018-0776-9. Epub 2018 Dec 12. Nature. 2018. PMID: 30542166
-
Sea surface temperature variability: patterns and mechanisms.Ann Rev Mar Sci. 2010;2:115-43. doi: 10.1146/annurev-marine-120408-151453. Ann Rev Mar Sci. 2010. PMID: 21141660 Review.
-
Chapter 1. Impacts of the oceans on climate change.Adv Mar Biol. 2009;56:1-150. doi: 10.1016/S0065-2881(09)56001-4. Adv Mar Biol. 2009. PMID: 19895974
-
Phenological Responses to ENSO in the Global Oceans.Surv Geophys. 2017;38(1):277-293. doi: 10.1007/s10712-016-9391-1. Epub 2016 Nov 9. Surv Geophys. 2017. PMID: 32269401 Free PMC article. Review.
References
-
- Stocker T. F., The silent services of the world ocean. Science 350, 764–765 (2015). - PubMed
-
- U. Cubasch, D. Wuebbles, D. Chen, M. C. Facchini, D. Frame, N. Mahowald, J.-G. Winther, “Introduction” in Climate Change 2013 – The Physical Science Basis: Working Group I Contribution to the Fifth Assessment Report of the Intergovernmental Panel on Climate Change, T. F. Stocker, D. Qin, G.-K. Plattner, M. Tignor, S. K. Allen, J. Boschung, A. Nauels, Y. Xia, V. Bex, P. M. Midgley, Eds. (Cambridge Univ. Press, 2014), pp. 119–158.
-
- N. L. Bindoff, W. W. L. Cheung, J. G. Kairo, J. Arístegui, V. A. Guinder, R. Hallberg, N. Hilmi, N. Jiao, M. S. Karim, L. Levin, S. O’Donoghue, S. R. P. Cuicapusa, B. Rinkevich, T. Suga, A. Tagliabue, P. Williamson, “Changing Ocean, Marine Ecosystems, and Dependent Communities” in The Ocean and Cryosphere in a Changing Climate: Special Report of the Intergovernmental Panel on Climate Change, H.-O. Pörtner, D. C. Roberts, V. Masson-Delmotte, P. Zhai, M. Tignor, E. Poloczanska, K. Mintenbeck, A. Alegría, M. Nicolai, A. Okem, J. Petzold, B. Rama, N. M. Weyer, Eds. (Cambridge Univ. Press, 2022), pp. 447–588.
-
- Cheng L., Abraham J., Hausfather Z., Trenberth K. E., How fast are the oceans warming? Science 363, 128–129 (2019). - PubMed
LinkOut - more resources
Full Text Sources

