. 2025 Jun 20;90(24):8214-8227.
doi: 10.1021/acs.joc.5c00668. Epub 2025 Jun 6.

Photoactivation of BODIPY Fluorescence with Green Light

Affiliations

Photoactivation of BODIPY Fluorescence with Green Light

Andrea Tomassini et al. J Org Chem. .

Abstract

Existing synthetic dyes with photoactivatable fluorescence demand ultraviolet radiation or, at best, violet light for fluorescence photoactivation. Illumination of biological samples within this range of relatively short wavelengths, however, causes significant photodamage. Strategies for the photochemical generation of fluorescent products under irradiation at wavelengths longer than 500 nm with moderate power densities are urgently needed to enable live-cell imaging with negligible phototoxicity. We identified a possible structural design to satisfy these stringent irradiation requirements. Specifically, we demonstrated that illumination of a borondipyrromethene (BODIPY) chromophore in the green region of the visible spectrum cleaves an adjacent oxazine heterocycle to form a fluorescent product with an emission in the red spectral window. We successfully photoactivated this compound with a 561 nm laser and localized single molecules of the fluorescent product with nanometer precision under 581 nm excitation, even in the interior of live cells. Indeed, we reconstructed subdiffraction images of the nanostructured lysosomes of the labeled cells under such unprecedented illumination conditions. Our results clearly indicate that this photochemical strategy for fluorescence photoactivation is a viable one for the realization of very-much needed photoactivatable synthetic dyes for super-resolution imaging with live-cell compatible irradiation requirements.


Conflict of interest statement

The authors declare no competing financial interest

Figures

Figure 1.
Figure 1.
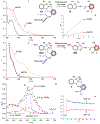
Absorption spectra (a) of aerated MeCN solutions (45 μM) of OX, 1 and 2. Absorption (b) and mass (c) spectra of an aerated MeCN solution (100 μM) of OX before (black trace) and after (red trace) irradiation (300–400 nm, 3.5 ± 0.4 mW cm–2). Chromatograms [d, BDS C18, MeCN/H2O (60:40 → 100:0 v/v in 10 min), 1.0 mL min–1] of an aerated MeCN solution (100 μM) of OX recorded before (black trace) and after (red trace) irradiation (365 nm, 43.7 ± 3.1 mW cm–2, 10 min) with absorbance detection (280 nm).
Figure 2.
Figure 2.
Absorption spectra of aerated MeCN or PhMe solutions (100 μM) of OX (a) or MOX (c) before (black trace) and after (red trace) irradiation (300–400 nm, 3.5 ± 0.4 mW cm–2, 10 min). Concentrations (b) of IN determined before and after irradiation (2 min) by HPLC. Transient absorption spectra (d) of aerated MeCN or PhMe solutions (100 μM) of OX, observed 10 and 330 μs after pulsed laser excitation (355 nm, 12 mJ per pulse, 6 ns), together with the difference between the absorption spectra before and after continuous irradiation (10 min) in PhMe, computed absorption spectrum [M062X, 6–311+G(d,p), PCM-IEF for PhMe] of 5 and absorbance evolutions (e) at 390 and 500 nm upon laser excitation in PhMe.
Figure 3.
Figure 3.
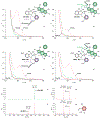
Absorption spectra (a) of aerated MeCN solutions (20 μM) of OX, OX–BO and OX–IN. Absorption (b) and mass (c and d) spectra of an aerated MeCN solution (25 μM) of OX–BO before (green trace) and after (red trace) irradiation (300–400 nm, 3.5 ± 0.4 mW cm–2). Chromatograms [e, BDS C18, MeCN/H2O (60:40 → 100:0 v/v in 13 min), 1.5 mL min–1] of an aerated MeCN solution (100 μM) of OX–BO recorded before (green trace) and after (red trace) irradiation (365 nm, 43.7 ± 3.1 mW cm–2, 10 min) with absorbance detection (350 nm).
Figure 4.
Figure 4.
Absorption spectra of aerated MeCN or PhMe solutions (25 μM) of OX–BO or MOX–BO before (green trace) and after (red trace) ultraviolet (a and c: 300–400 nm, 3.5 ± 0.4 mW cm–2) or visible (b and d: 480–560 nm, 46.9 ± 4.7 mW cm–2) irradiation for 2 min in PhMe of a or 10 min in all other instances. Mass spectra of an aerated PhMe solution (25 μM) of OX–BO before (e) and after (f and g) visible irradiation (480–560 nm, 46.9 ± 4.7 mW cm–2, 10 min) and mass spectrum of 6 (h).
Figure 5.
Figure 5.
Plausible mechanism for the photoinduced conversion of OX–BO into INBO and 7 upon visible illumination with the subsequent formation of 6.
Figure 6.
Figure 6.
Emission spectra (480 nm) of aerated MeCN (a) or PhMe (b) solutions (1 μM) of OX–BO, IN–BO, MOX–BO and MIN–BO. Emission spectra (580 nm) of aerated MeCN (c) or PhMe (d) solutions (1 μM) of OX–BO before (green trace) and after (red trace) ultraviolet (300–400 nm, 3.5 ± 0.4 mW cm–2) irradiation for 2–10 min in c or 2 min in d or after visible (480–560 nm, 46.9 ± 4.7 mW cm–2) irradiation for 10 min in d.
Figure 7.
Figure 7.
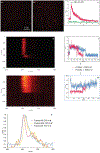
Single-molecule fluorescence images (589 nm, 44 W cm–2) of OX–BO deposited on glass recorded before (a) and after (b) photoactivation (561 nm, 35 W cm–2). Plots (c) of the number of single-molecule counts detected over a period of 50 s without (green trace) and with (red trace) 561-nm photoactivation at 3 s. Spectral evolutions (d and e) for two representative single molecules of OX–BO with the corresponding emission intensity profiles (f, 561 nm, 35 W cm–2, 589 nm, 230 W cm–2), spectral centroid evolutions (g) and averaged single-molecule spectra (h).
Figure 8.
Figure 8.
Epifluorescence images (a and b, 561 nm, 3 W cm–2) of a live U2OS cell stained with OX–BO and the corresponding PALM images (c and d, 561 nm, 0–394 W cm–2, 589 nm, 451 W cm–2) with photon budget (e), localization precision (f) and a representative emission intensity profile (g).

Similar articles

References

    1. Betzig E; Patterson GH; Sougrat R; Lindwasser OW; Olenych S; Bonifacino JS; Davidson MW; Lippincott-Schwartz J; Hess HF Imaging intracellular fluorescent proteins at nanometer resolution. Science 2006, 313, 1642–1645. - PubMed
    1. Sengupta P; van Engelenburg SB; Lippincott-Schwartz J Superresolution imaging of biological systems using photoactivated localization microscopy. Chem. Rev 2014, 114, 3189–3202. - PMC - PubMed
    1. Liu Z; Lavis LD; Betzig E Imaging live-cell dynamics and structure at the single-molecule level. Mol. Cell 2015, 58, 644–659. - PubMed
    1. Sahl SJ; Hell SW; Jakobs S Fluorescence nanoscopy in cell biology. Nat. Rev. Mol. Cell Biol 2017, 18, 685–701. - PubMed
    1. Sauer M; Heilemann M Single-molecule localization microscopy in eukaryotes. Chem. Rev 2017, 117, 7478–7509. - PubMed

Substances

LinkOut - more resources