. 2025 Aug:74:101575.
doi: 10.1016/j.dcn.2025.101575. Epub 2025 May 31.

Resting state EEG classifies developmental status in three-year-old children

Affiliations

Resting state EEG classifies developmental status in three-year-old children

Dhanya Parameshwaran et al. Dev Cogn Neurosci. 2025 Aug.

Abstract

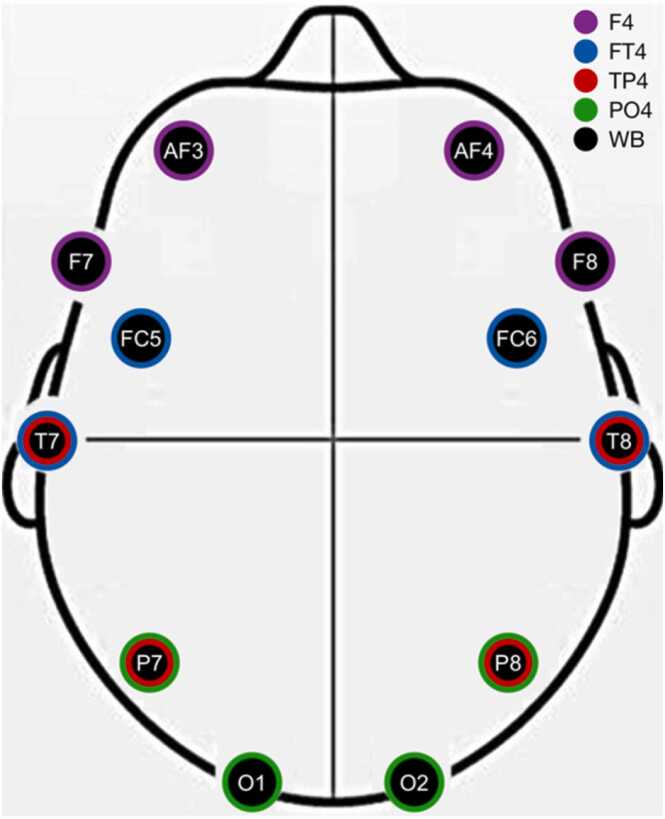
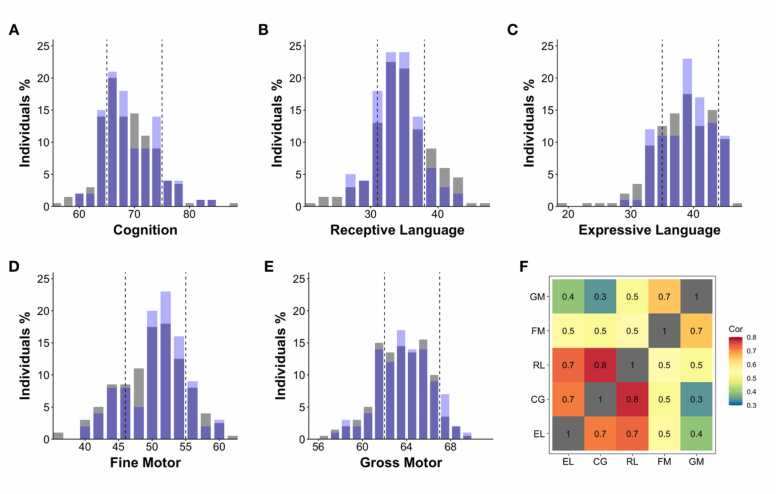
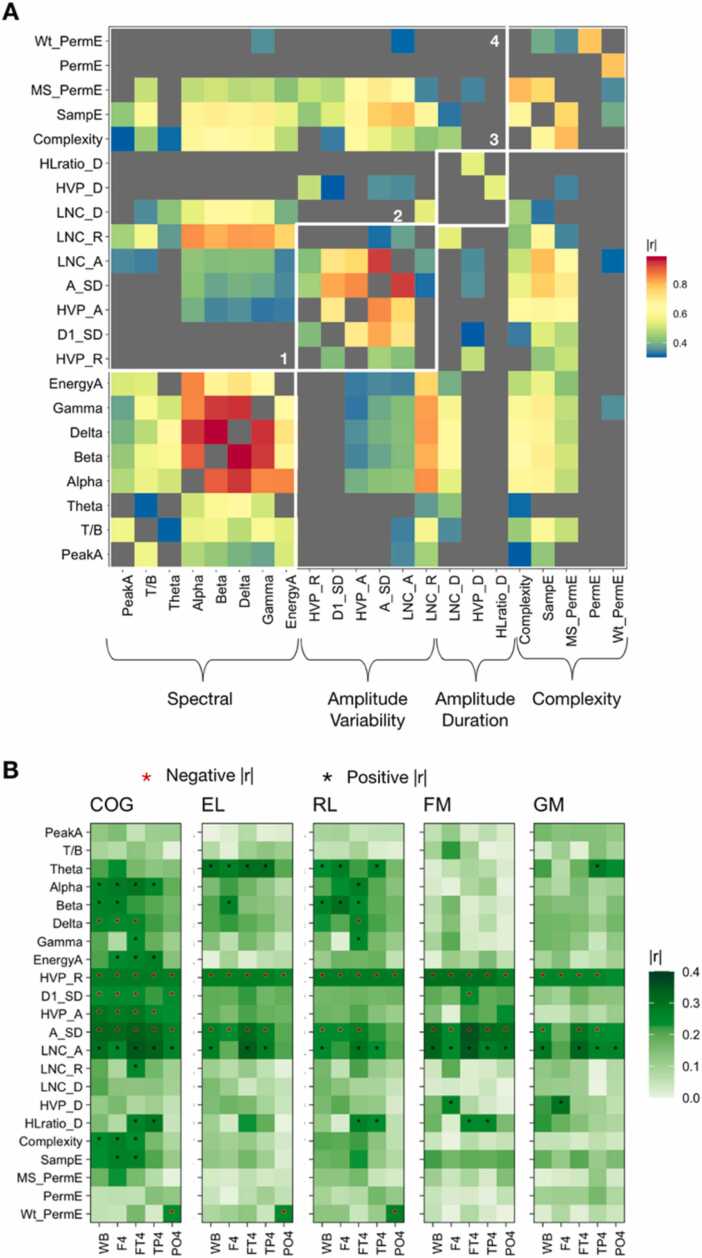
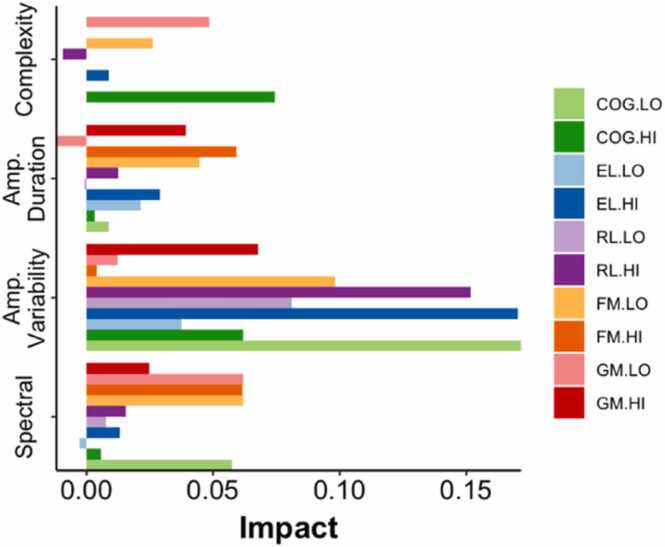
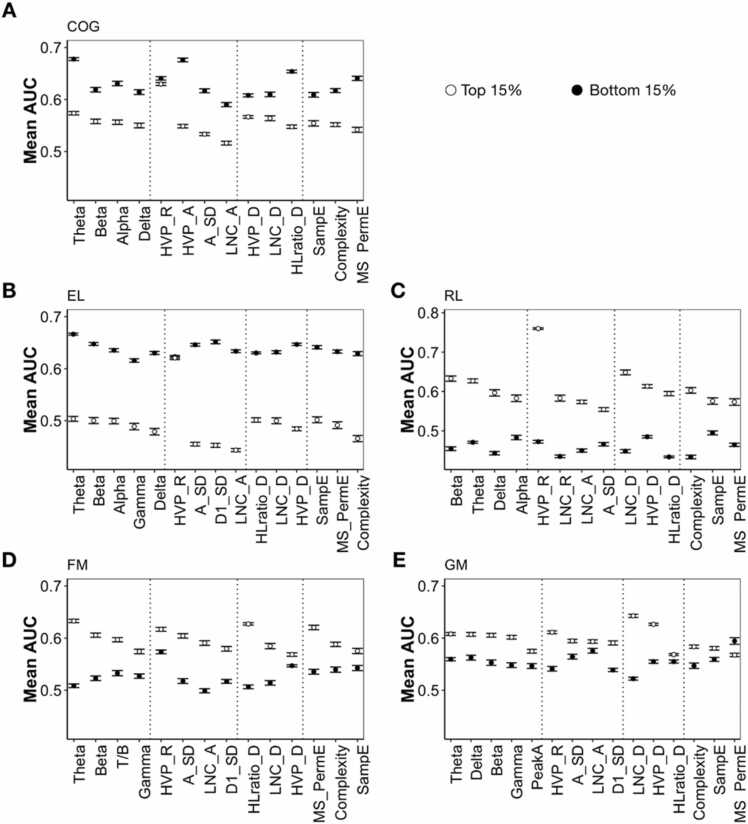
Monitoring cognitive development in early childhood enables detection of problems for timely intervention. However, currently recommended methods require lengthy evaluations of task performance, and are resource intense. Here we examined whether 3 minutes of resting-state EEG (rs-EEG) recorded in 70 33-40-month-old children using a 14-channel portable EEG device in low-resource households could classify performance on five domains of developmental outcomes (cognition, receptive language, expressive language, fine motor and gross motor coordination) as measured by the Bayley's Scale of Infant and Toddler Development, 3rd Edition (BSID-III). Applying supervised learning models to a combination of spectral features and novel time-domain features derived from EEG data, we predicted BSID-III domain scores with moderate accuracy (AUCs ranging from 0.70 to 0.84 and F1-scores ranging from 0.58 to 0.76). While spectral frequencies significantly correlated with cognitive and language domain scores, time-domain features describing amplitude variability were more significantly correlated and contributed more substantially to model outcomes. Model performance was reliable even with a subset of 4 channels. Overall, this study provides a first demonstration that rs-EEG from low electrode configuration devices can serve as a quick and reliable indicator of cognitive developmental outcomes and aid in identifying those requiring support during early childhood.

Keywords: BSID; Bayley’s Scale of Infant and Toddler Development; Cognitive health; Early child development; Machine learning; Resting-state EEG.


Conflict of interest statement

Declaration of Competing Interest The authors declare that they have no known competing financial interests or personal relationships that could have appeared to influence the work reported in this paper.

Figures

Fig. 1
Fig. 1
EEG features were created by averaging features from all 14 recording channels O1, O2, AF3, F3, AF4, F4, FC5, FC6, F7, T7, P7, F8, T8, P8 (WB) as well as four subsets electrode configurations. AF3, AF4, F7, F8 (F4) and T7, T8, FC5, FC6 (FT4), T7,T8, P7, P8 (TP4) and P7,P8,O1,O1 (PO4).
Fig. 2
Fig. 2
Distribution of five domains of BSID-cognitive scores. (A-E) Histograms of BSID scores across each domain namely cognitive, receptive language, expressive language, fine motor and gross motor (grey bars N = 200); purple bars represent the scores for the subset with EEG (N = 70). (F) Correlations of BSID domain scores (N = 70). Correlogram shows that language and cognition scores are closely related but distinct from motor skill domains. CG = Cognition, RL = Receptive Language, EL = Expressive Language, FM = Fine Motor, GM = Gross Motor.
Fig. 3
Fig. 3
Correlations between EEG features and BSID scores. (A) Correlogram showing clustering of EEG metrics estimated from whole brain averages demonstrating that metrics constructed to capture the same or similar feature of the EEG tend to be in correlated groups. White boxes show feature groups. (B) Correlation between the 5 BSID domains and 22 EEG features for 5 electrode configurations - Whole brain (WB), Frontal (F4) and Fronto-temporal (FT4), Temporo-parietal (TP4) and Parieto-occipital (PO4). The EEG features have been ordered according by Groups 1–4 shown in Methods. Group 2 Amplitude variability metrics were the most correlated with BSID domains, with maximum correlation for the 5 BSID domains ranging between 0.3 and 0.36.
Fig. 4
Fig. 4
| Impact of each cluster of features on predictionsImpact of features in each cluster for prediction of the top 15 % (Hi) and bottom 15 % (Lo) for each of the domains Cognitive (COG), Expressive Language (EL), Receptive language (RL), Fine Motor (FM) and Gross Motor (GM). Cluster 2 features caused most reduction of AUC in cognition and language domains whereas clusters 1 and 4 features had higher impact in the motor domains.
Fig. 5
Fig. 5
| Relative Model Performance by Metric Groups Mean AUC± SEM of models featuring specific metrics. Values are arranged by their feature grouping for the whole brain electrode configuration and sorted based on top 15 % results. Models containing the amplitude variability metric HVP_R substantially outperformed other metrics in the feature group.

Similar articles

Cited by

  • EEG Data Quality in Large-Scale Field Studies in India and Tanzania.
    Vianney JM Sr, Swaminathan S, Newson JJ, Parameshwaran D, Puthanmadam Subramaniyam N, Roy SS, Machunda R, Sapuli A, Pramanik S, Arun Kumar JV, Tiwari P, Mathews Mathuram GN, Bembeleza LB, Laiser JP, Luhwago WJ, Maduka TP, Mollel JO, Mollel NG, Mugizi AA, Mwamakula IL, Rweyemamu RE, Samweli UF, Simpito JI, Shirima KE, Anbalagan A, Arumugam SK, Dhanapal V, Gunasekaran K, Kashyap N, Kumar D, Pandey D, Pandey P, Panneerselvam A, Rai S, Rajendran P, Sekar S, Sivalingam O, Soni P, Soni P, Thiagarajan TC. Vianney JM Sr, et al. eNeuro. 2025 Jul 25;12(7):ENEURO.0006-25.2025. doi: 10.1523/ENEURO.0006-25.2025. Print 2025 Jul. eNeuro. 2025. PMID: 40691075 Free PMC article.

References

    1. Acunzo D.J., MacKenzie G., van Rossum M.C.W. Systematic biases in early ERP and ERF components as a result of high-pass filtering. J. Neurosci. Methods. 2012;209:212–218. doi: 10.1016/j.jneumeth.2012.06.011. - DOI - PubMed
    1. Anderson A.J., Perone S. Developmental change in the resting state electroencephalogram: insights into cognition and the brain. Brain Cogn. 2018;126:40–52. doi: 10.1016/j.bandc.2018.08.001. - DOI - PubMed
    1. Bandt C., Pompe B. Permutation entropy: a natural complexity measure for time series. Phys. Rev. Lett. 2002;88 doi: 10.1103/PhysRevLett.88.174102. - DOI - PubMed
    1. Bayley, N., 2006a. Bayley Scales of Infant and Toddler Development —Third Edition: Administration manual., 3rd ed. Antonio, TX.
    1. Bayley, N., 2006b. Bayley Scales of Infant and Toddler Development —Third Edition: Technical manual., 3rd ed. San Antonio, TX.

Further reading

    1. Gilmore J.H., Knickmeyer R.C., Gao W. Imaging structural and functional brain development in early childhood. Nat. Rev. Neurosci. 2018;19:123–137. doi: 10.1038/nrn.2018.1. - DOI - PMC - PubMed
    1. Gramfort A. MEG and EEG data analysis with MNE-Python. Front. Neurosci. 2013;7 doi: 10.3389/fnins.2013.00267. - DOI - PMC - PubMed