. 2025 Jul:117:105791.
doi: 10.1016/j.ebiom.2025.105791. Epub 2025 Jun 6.

Mazdutide, a dual agonist targeting GLP-1R and GCGR, mitigates diabetes-associated cognitive dysfunction: mechanistic insights from multi-omics analysis

Affiliations

Mazdutide, a dual agonist targeting GLP-1R and GCGR, mitigates diabetes-associated cognitive dysfunction: mechanistic insights from multi-omics analysis

Wanqing Dong et al. EBioMedicine. 2025 Jul.

Abstract

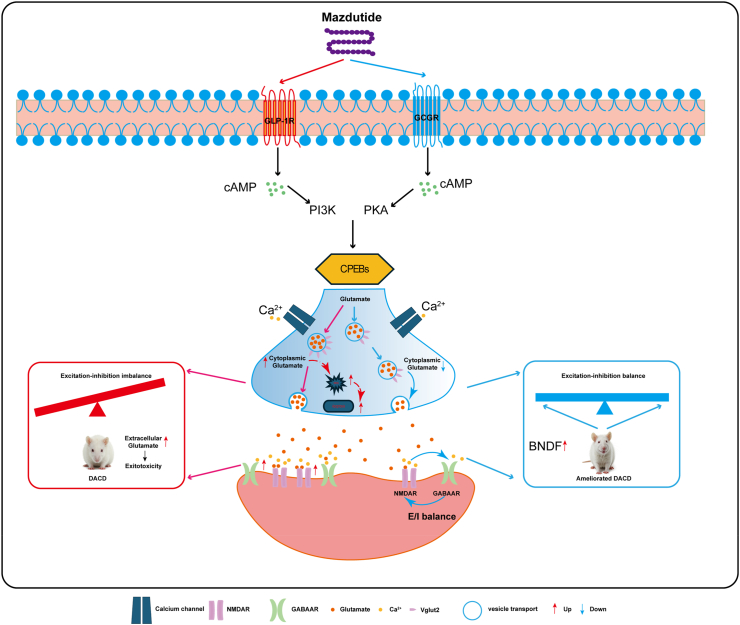
Background: Cognitive impairment and dementia are highly associated with obesity and type 2 diabetes mellitus (T2DM). Recent studies have demonstrated that GLP-1 receptor agonists can improve cognitive function through brain activation in patients with T2DM, compared to other oral glucose-lowering drugs. Mazdutide, a dual agonist of the glucagon-like peptide-1 receptor (GLP-1R) and the glucagon receptor (GCGR), has been shown to simultaneously reduce body weight, blood glucose levels, and other comorbidities associated with obesity in patients with T2DM. While its insulinotropic and glucose-lowering effects through the GLP-1 pathway are well-established, mazdutide may also enhance energy expenditure via activation of the GCGR pathway. However, its potential impact on cognitive function remains to be elucidated.

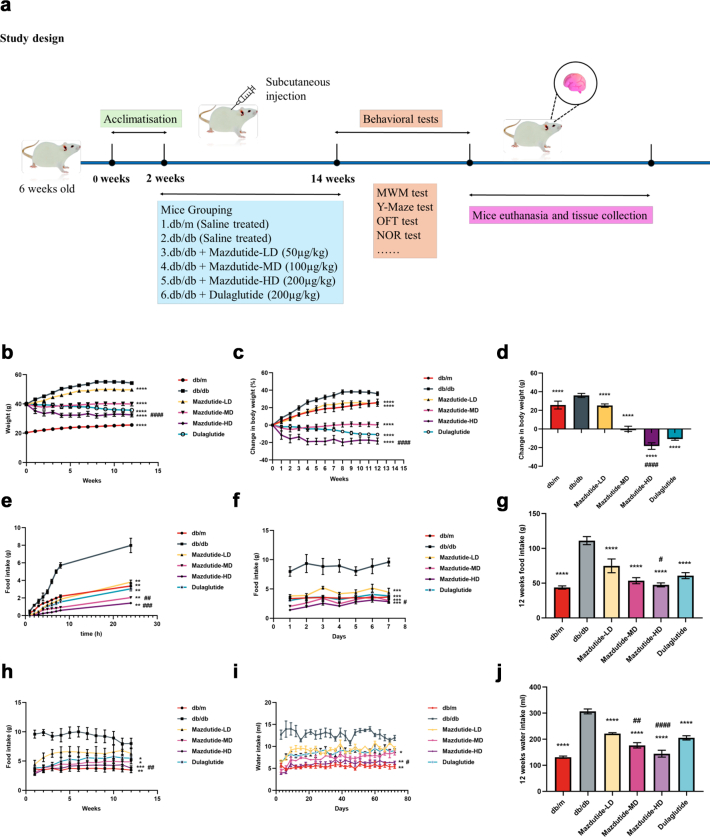
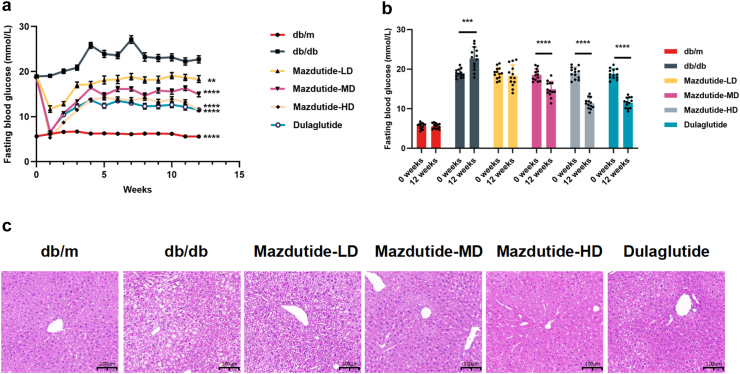
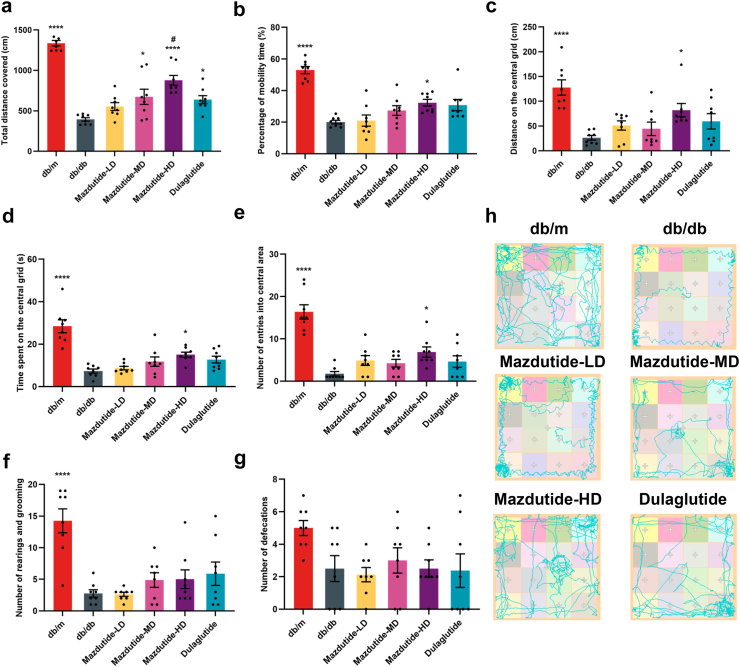
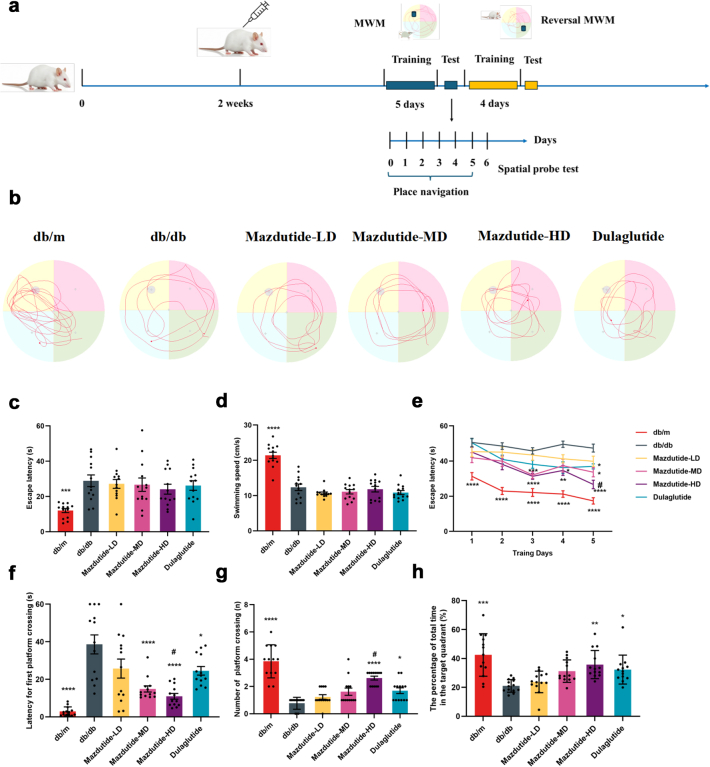
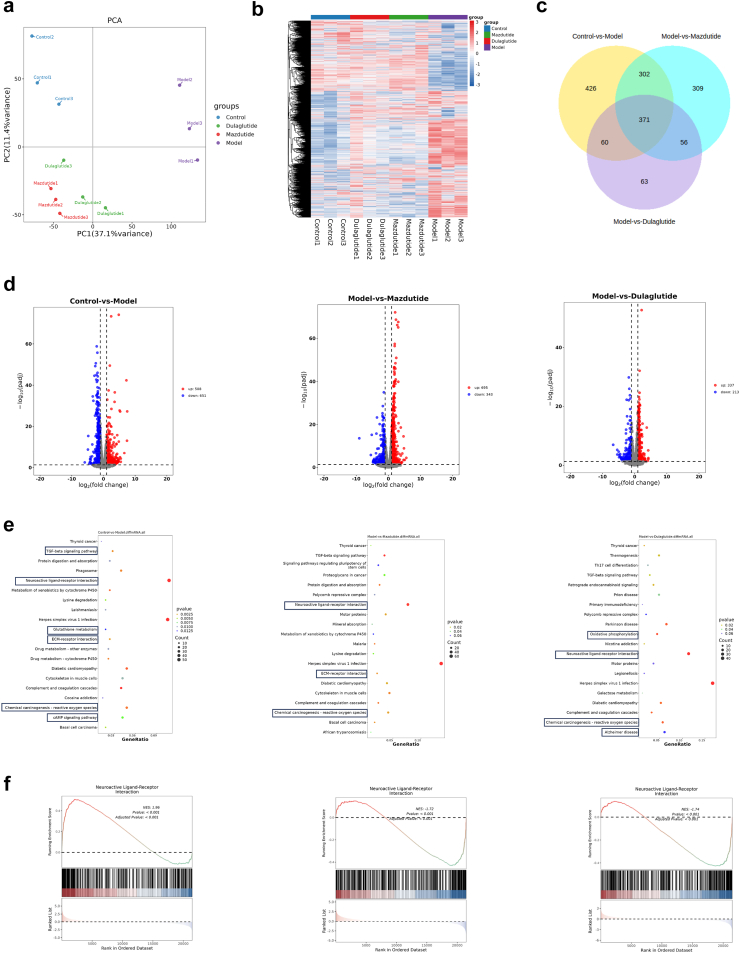
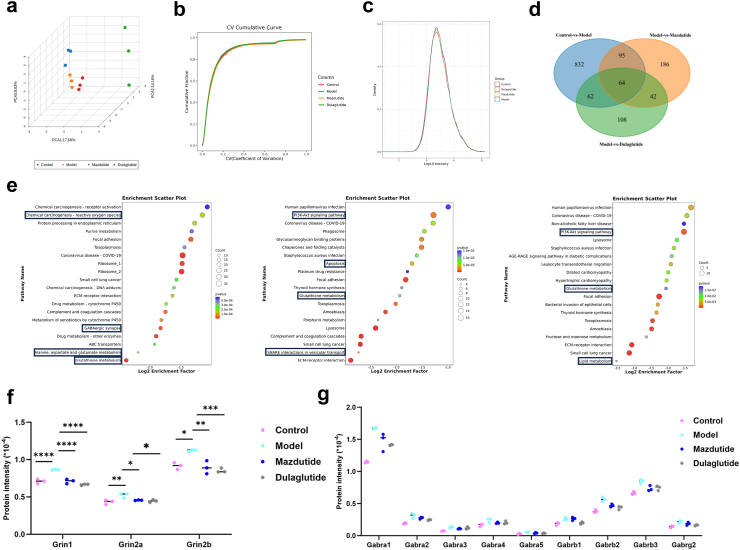
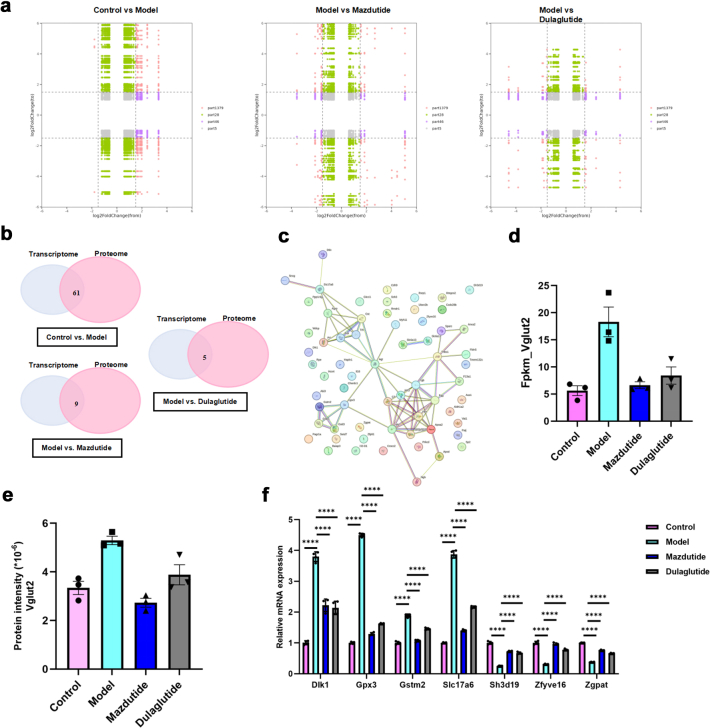
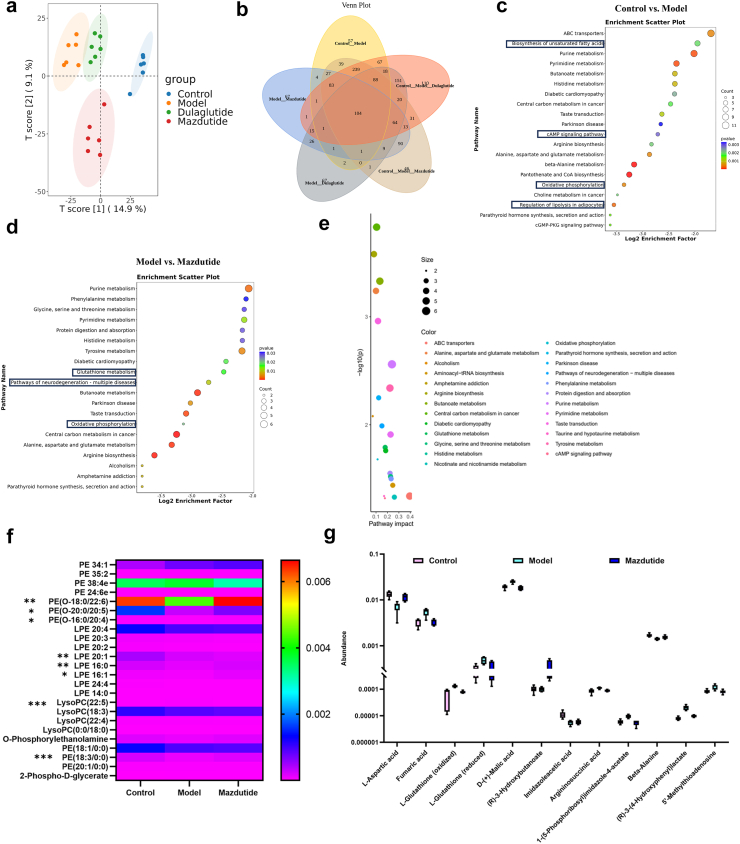
Methods: This study aimed to investigate the effects of mazdutide on cognitive behaviour and cerebral pathology in male db/db mice, a model of T2DM, in comparison to dulaglutide, a GLP-1 receptor agonist. All animal findings are applicable to male mice only. Behavioural tests were conducted to evaluate cognitive function, and pathological analyses were performed to assess neurodegenerative markers in the brain. Furthermore, transcriptomic, proteomic, and metabolomics analyses were employed to explore the underlying molecular mechanisms of mazdutide's effects.

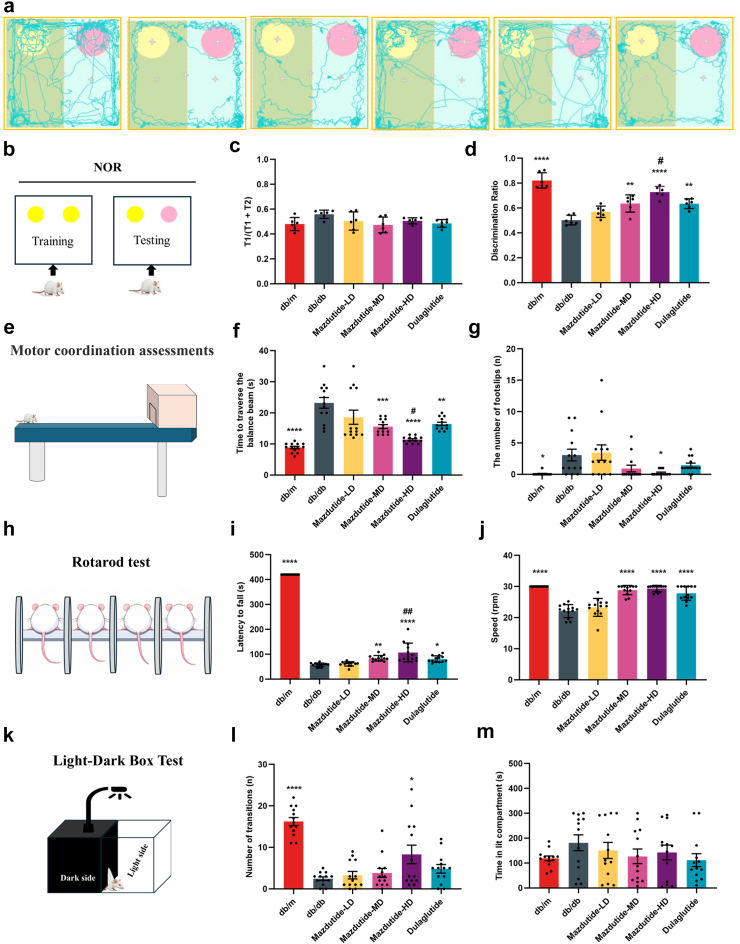
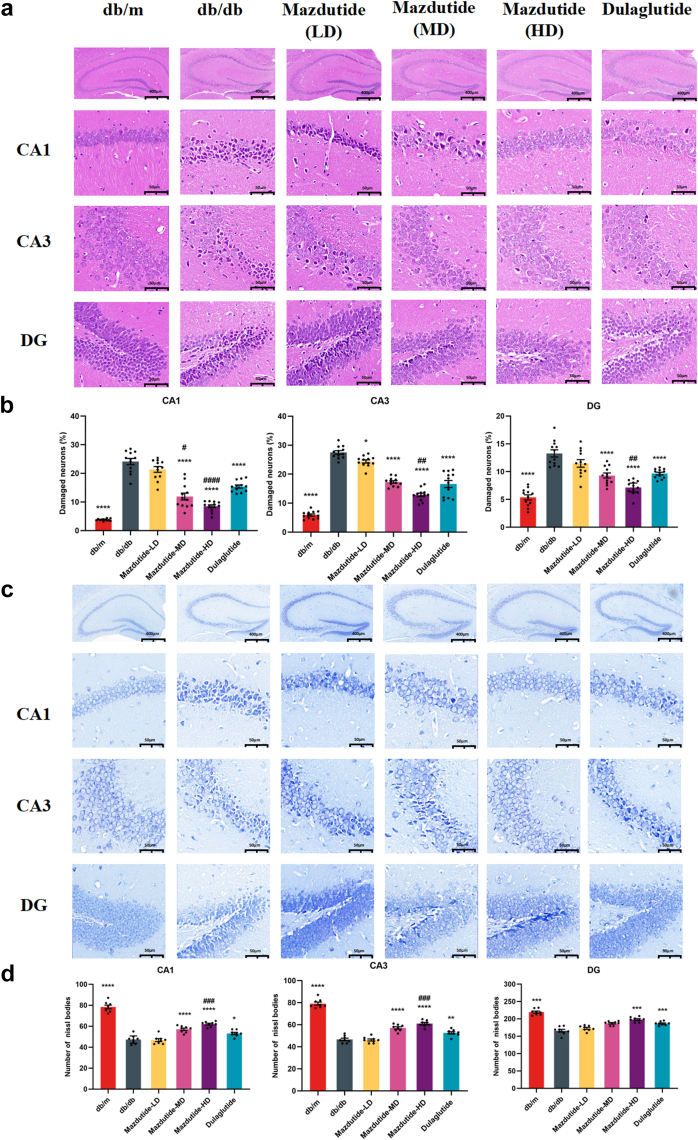
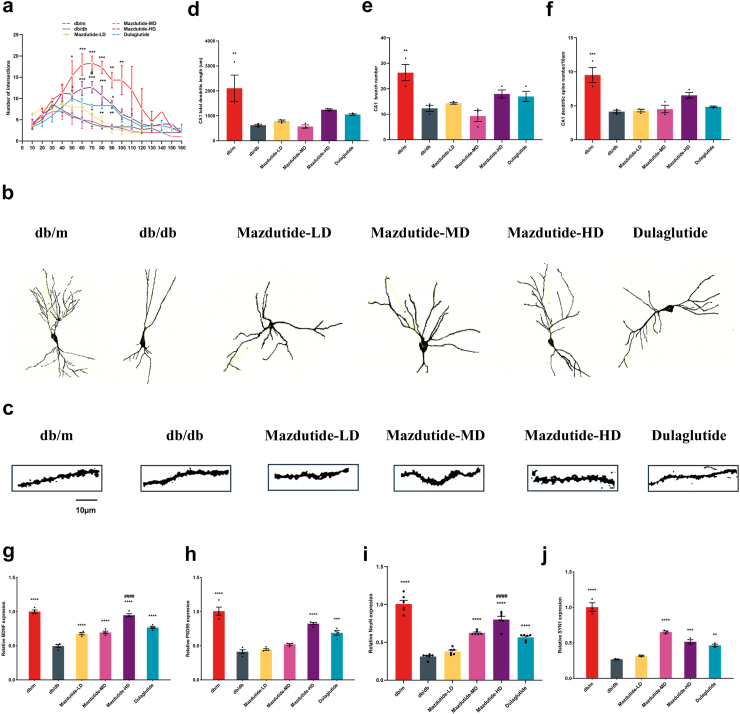
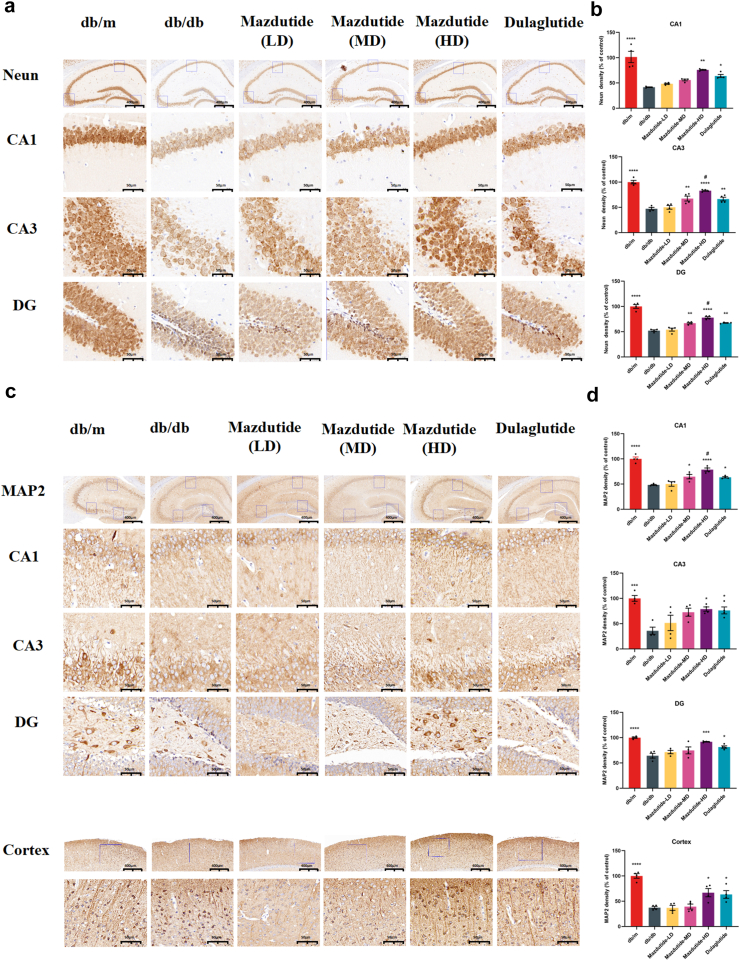
Findings: Compared to dulaglutide, mazdutide significantly improved cognitive performance in db/db mice, as evidenced by comprehensive behavioural tests. Pathological assessments revealed improvements in neuronal structure and brain tissue integrity in the mazdutide-treated group. Multi-omics analyses further identified distinct molecular pathways involved in neuroprotection, energy metabolism, and synaptic plasticity, suggesting that dual GLP-1/GCGR activation contributes to enhanced cognitive resilience.

Interpretation: Our findings indicate that mazdutide, via its dual GLP-1/GCGR activation effects, exerts multifactorial improvements in cognitive function in the context of obesity and T2DM. These results suggest that mazdutide is a promising therapeutic option for mitigating cognitive deficits associated with metabolic disorders.

Funding: Medical Science and Technology Research and Development Plan Major Project Jointly Constructed by the Henan Province and Ministerial Departments in China (No. SBGJ202301010).

Keywords: Diabetes-associated cognitive dysfunction; GLP-1R/GCGR dual agonism; Mazdutide; db/db mice.


Conflict of interest statement

Declaration of interests Innovent Biologics, Inc. provided Mazdutide for use in this study. The authors declare no other competing interests.

Figures

Fig. 1
Fig. 1
Effect of mazdutide on body weight, food and water intake in db/db mice. (a) Study design illustration during the period of drug administration in db/db mice. (b) Effect on body weight and relative (c) and absolute (d) change following once-every-three days treatment (12 weeks) with dual GLP-1R/GCGR agonist mazdutide with low-, middle-, and high-dose (50, 100, 200 μg/kg) or dulaglutide (200 μg/kg). (e–h) 24 h, one week and 12 weeks of food intake after administration of saline, mazdutide, and dulaglutide. (i, j) The changes of water consumption within consecutive 12 weeks and total water intake. (b–d) n = 13/group; (e–j) n = 4 cages/group (3–4 mice per cage), data represent cage means. Data are represented as mean ± SD and were analysed by repeated-measures two-way ANOVA (b, c, e, f, h, i), one-way ANOVA with post hoc Tukey's multiple comparison test (d, g, j) at study end. ∗p < 0·05, ∗∗p < 0·01, ∗∗∗p < 0·001, ∗∗∗∗p < 0·0001 compared with db/db mice group; #p < 0·05, ##p < 0·01, ###p < 0·001, ####p < 0·0001 compared mazdutide group with dulaglutide group.
Fig. 2
Fig. 2
12-week treatment effects of mazdutide and dulaglutide in db/db mice. (a, b) Effects on blood glucose level (n = 13). (c) Representative liver section images of H&E staining in saline (db/db and db/m), mazdutide and dulaglutide treatments are shown (scale bar: 100 μm, 200× magnification). Data are represented as mean ± SD and were analysed by repeated-measures two-way ANOVA (a) and two-tailed paired t-test with post hoc Tukey's multiple comparison test (b) at study end. ∗∗p < 0·01, ∗∗∗p < 0·001, ∗∗∗∗p < 0·0001 compared with db/db mice group.
Fig. 3
Fig. 3
Mazdutide improves exploratory behaviours in T2DM db/db mice. (a) Total distance travelled in the open field; (b) Percentage of mobility time; (c) Distance on the central grid; (d) Time spent on the central grid; (e) Number of entries into central area; (f) Number of rearings and groomings; (g) Number of defecations; (h) Representative travel pathway of mice exploration during the open field tests (OFT). Results are expressed as mean ± SD and were analysed by one-way ANOVA (a-g) with post hoc Tukey's multiple comparison test. db/db, db/m, Mazdutide-LD, Mazdutide-MD, Mazdutide-HD, and Dulaglutide (n = 8) mice per group. ∗p < 0·05, ∗∗∗∗p < 0·0001 compared with db/db group; #p < 0·05 compared Mazdutide with Dulaglutide group.
Fig. 4
Fig. 4
Mazdutide attenuates the learning and memory impairments in T2DM db/db mice. (a) The time axis diagram of Morris water maze (MWM) and reversal MWM tests; (b) Representative traces in MWM test; (c) The mean escape latency and (d) the swimming speed (cm/s) before the orientation navigation experiment; (e) The escape latency of five consecutive days training in the quadrant of the platform; (f) Latency of first crossing to the platform in spatial probe test; (g) Number of crossing the platform; (h) The percentage of total time in the target quadrant. db/db, db/m, Mazdutide-LD, Mazdutide-MD, Mazdutide-HD, and Dulaglutide (n = 13) mice per group. Data are represented as mean ± SD and were analysed by repeated-measures two-way ANOVA (e), one-way ANOVA (c, d, f, g, h) with post hoc Tukey's multiple comparison test at study end. ∗p < 0·05, ∗∗p < 0·01, ∗∗∗p < 0·001, ∗∗∗∗p < 0·0001 compared with db/db group; #p < 0·05 compared Mazdutide with Dulaglutide group.
Fig. 5
Fig. 5
Mazdutide comprehensively ameliorate cognitive impairment of db/db mice in other multiple cognitive behaviours. (a–d) Results of the novel object recognition (NOR) test. (e–g) Results of beam-walking test. (h–j) Results of rotarod test. (k–m) Results of light/dark (LD) transition test. (a–b) The travel traces and schematic diagram of NOR test. (c, d) Percentage of exploration time spent in T1 phase on the novel object (c) and the object-location discrimination ratio (d). (e–g) The diagram of beam-walking test (e); time spent to traverse the balance beam (f) and the number of foot slips on the beam (g). (h–j) Schematic diagram of rotarod test (h); (i) latency to fall and (j) rotarod speed (j). (k–m) Schematic diagram of light/dark (LD) transition test (k); (m) time spent in the lit box and number of transitions (l). Data are represented as mean ± SD in (c, d, i, j) and mean ± SEM in (f, g, l, m), and were analysed by one-way ANOVA (c, d, f, g, i, j, l, m) with post hoc Tukey's multiple comparison test at study end. n = 6 for c, d; n = 13 for f, g, i, j, l, m.∗p < 0·05, ∗∗p < 0·01, ∗∗∗p < 0·001, ∗∗∗∗p < 0·0001 compared with db/db group; #p < 0·05, ##p < 0·01 compared Mazdutide with Dulaglutide group.
Fig. 6
Fig. 6
The histological changes in CA1, CA3, and DG regions of mouse hippocampus of db/m, db/db, Mazdutide-LD, Mazdutide-MD, Mazdutide-HD, and Dulaglutide groups by H&E and Nissl staining. (a) Representative micrographs of H&E staining (scale bar = 400 μm) in the CA1, CA3, and DG regions (scale bar = 50 μm); (b) The percentage of damaged neurons in the CA1, CA3, and DG regions (n = 4, three visual fields were counted per mouse); (c) Representative micrographs of Nissl staining (scale bar = 400 μm) in the CA1, CA3, and DG regions (scale bar = 50 μm); (d) Quantitative analysis of the number of Nissl bodies in hippocampus of in the CA1, CA3, and DG regions (n = 4, two visual fields were counted per mouse); Data are shown as means ± SEM and were analysed by one-way ANOVA (b, d) with post hoc Tukey's multiple comparison test at study end. ∗p < 0·05, ∗∗p < 0·01, ∗∗∗p < 0·001, ∗∗∗∗p < 0·0001 compared with db/db group; #p < 0·05, ##p < 0·01, ###p < 0·001, ####p < 0·0001 compared Mazdutide with Dulaglutide group.
Fig. 7
Fig. 7
Mazdutide ameliorated abnormal neuronal morphology and loss of dendritic spines in the hippocampal CA1 region of db/db mice. (a) Quantification of dendritic intersections of neuronal dendrites in the hippocampus among the six groups in CA1; (b) Representative images of hippocampal neuronal tracings. (c) Representative images of Golgi-stained dendritic spine segments from the hippocampal CA1 region from each experimental group. Scale bar, 10 μm (d) total dendritic length in CA1 area; (e) the number of neuronal branches in the CA1 area of hippocampus and (f) CA1 dendritic spine number per 10 μm of hippocampal neurons; (g–j) BDNF, PSD95, NEUN, and SYN1 mRNA expression collectively reflect neuronal survival status, synaptic structure, and plasticity. Data are presented as the mean ± SEM and were analysed by one-way ANOVA with post hoc Tukey's multiple comparison test. n = 3 for a, d, e, f, j; n = 4 for g, h; n = 6 for i. ∗p < 0·05, ∗∗p < 0·01, ∗∗∗p < 0·001, ∗∗∗∗p < 0·0001 compared with db/db group; #p < 0·05, ####p < 0·0001 compared Mazdutide with Dulaglutide group.
Fig. 8
Fig. 8
Immunohistochemical staining for neuronal nuclei (NeuN) and MAP2 in db/db, db/m, mazdutide-LD, mazdutide-MD, mazdutide-HD, and dulaglutide groups. (a, c) Representative immunohistochemical staining slices in the whole hippocampus (scale bar = 400 μm, 100× magnification) and its magnified CA1, CA3, and DG regions (scale bar = 50 μm, 400× magnification). (b, d) Quantitative analysis results of NeuN and MAP2 density (% of control) in the all groups (n = 4). ∗p < 0·05, ∗∗p < 0·01, ∗∗∗p < 0·001 compared with db/db model group; #p < 0·05 compared Mazdutide with Dulaglutide group.
Fig. 9
Fig. 9
Transcriptomic analysis reveals an abundance of gene profiles across the disease spectrum of hippocampus in DACD. (a) Principal component analysis (PCA) of Control, Model, Mazdutide, and Dulaglutide. (b) Heatmap of the gene expression profile in all groups. (c) Venn diagram of DEGs (Control vs. Model), DEGs (Model vs. Mazdutide), and DEGs (Model vs. Dulaglutide). (d) Volcano plots depicting the numbers of up-regulated (red) and down-regulated (blue) DEGs between Control vs. Model, Model vs. Mazdutide, and Model vs. Dulaglutide. (e) The top 20 KEGG terms of DEGs between Control vs. Model, Model vs. Mazdutide, and Model vs. Dulaglutide. (f) Gene set enrichment analysis (GSEA) for KEGG in Model, Mazdutide, and Dulaglutide groups in certain pathways. n = 3.
Fig. 10
Fig. 10
Proteomic analysis reveals the potential regulatory role of mazdutide and dulaglutide on DACD. (a) PCA shows a clear separation among Control, Model, Mazdutide, and Dulaglutide groups. Each n = 3. (b) Coefficient of Variation (CV) represented better repeatability within groups. (c) The unimodal distributions of the protein intensities suggest no obvious degradation in samples. (d) Venn diagram of DEPs (Control vs. Model), DEPs (Model vs. Mazdutide), and DEPs (Model vs. Dulaglutide). (e) The top 20 KEGG terms of differentially expressed proteins (DEPs) between Control vs. Model, Model vs. Mazdutide, and Model vs. Dulaglutide. (f, g) Protein quantification analysis for NMDAR and GABAA. n = 3. ∗p < 0·05, ∗∗p < 0·01, ∗∗∗p < 0·001, ∗∗∗∗p < 0·0001.
Fig. 11
Fig. 11
Integrated analysis of proteomics and transcriptomics data. (a) Nine-quadrant plot shows the correlation of gene expression alterations between the mRNA and protein levels. (b) A Venn diagram shows the common DEPs and DEGs with consistent regulatory profile. (c) Protein network showing the protein–protein interactions (PPIs) between the 51 DEPs constructed using STRING software. (d, e) Transcriptomic analysis of Vglut2 mRNA levels and proteomic quantification of Vglut2 protein levels across experimental groups. (f) RT-qPCR was used to validate consistent DEGs and DEPs, which was reversed by Mazdutide or Dulaglutide compared to Model group (n = 4). ∗∗∗∗p < 0·0001.
Fig. 12
Fig. 12
The untargeted metabolomics revealed potential metabolites of candidate targets regulated by mazdutide. (a) PCA showed that Control group, Model group, Mazdutide group, and Dulaglutide group were well distinguished. (b) A Venn diagram shows DEMs in different groups. (c, d) The top 20 KEGG terms of DEMs between Control vs. Model and Model vs. Mazdutide. (e) KEGG pathway enrichment and impact score distribution for selected pathways in Model vs. Mazdutide groups. (f) The altered metabolites with a VIP value exceeding 1.0 were selected and visualised using a heat map. (g) Potential metabolic biomarkers were screened by mazdutide in corresponding enriched pathways (n = 6). ∗p < 0·05, ∗∗p < 0·01, ∗∗∗p < 0·001.
Fig. 13
Fig. 13
Schematic illustration of the potential mechanisms by which mazdutide regulates synaptic homoeostasis and excitatory–inhibitory balance in a mouse model of diabetes-associated cognitive dysfunction (DACD). This figure summarises the putative mechanisms through which mazdutide, a dual GLP-1R/GCGR agonist, may exert synaptic protective effects in a DACD mouse model. Experimental data indicate that mazdutide downregulates the expression of the presynaptic glutamate transporter VGluT2, thereby reducing excitatory transmission, and upregulates GABAA_AA receptor subunits, which may contribute to the restoration of synaptic excitatory–inhibitory (E/I) balance. Concurrent activation of the cAMP/PKA and PI3K–Akt signalling pathways has been shown to increase the expression of CPEB family members. The diagram also includes hypothetical mechanisms inferred from literature and multi-omics analyses, such as CPEB-mediated regulation of synaptic protein translation, upregulation of BDNF, and indirect modulation of oxidative stress and metabolic homoeostasis. Arrows indicate the directionality of regulatory effects.

Similar articles

References

    1. Biessels G.J., Despa F. Cognitive decline and dementia in diabetes mellitus: mechanisms and clinical implications. Nat Rev Endocrinol. 2018;14:591–604. - PMC - PubMed
    1. Shang Y., Fratiglioni L., Vetrano D.L., Dove A., Welmer A.K., Xu W. Not only diabetes but also prediabetes leads to functional decline and disability in older adults. Diabetes Care. 2021;44:690–698. - PMC - PubMed
    1. Chen S., Kuper H. Tracing the temporal trends of modifiable risk factors in dementia: insights from the English Longitudinal Study of Ageing (2004–2019) Lancet. 2023;402(Suppl 1):S34. - PubMed
    1. Ninomiya T. Diabetes mellitus and dementia. Curr Diab Rep. 2014;14:487. - PubMed
    1. Luo A., Xie Z., Wang Y., et al. Type 2 diabetes mellitus-associated cognitive dysfunction: advances in potential mechanisms and therapies. Neurosci Biobehav Rev. 2022;137 - PubMed

MeSH terms