

Wearables-derived risk score for unintrusive detection of α-synuclein aggregation or dopaminergic deficit
- PMID: 40479844
- PMCID: PMC12205697
- DOI: 10.1016/j.ebiom.2025.105782
Wearables-derived risk score for unintrusive detection of α-synuclein aggregation or dopaminergic deficit
Abstract
Background: Smartwatch data has been found to identify Parkinson's disease (PD) several years before the clinical diagnosis. However, it has not been assessed against the gold standard but costly and invasive biological and pathological markers for PD. These include dopaminergic imaging (DaTscan) and cerebrospinal fluid alpha-synuclein seed amplification assay (SAA), which are being studied as markers thought to represent the onset of PD pathology.
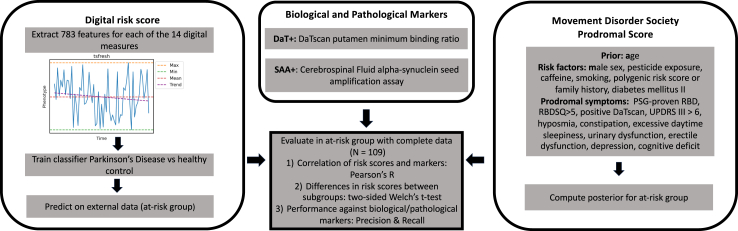
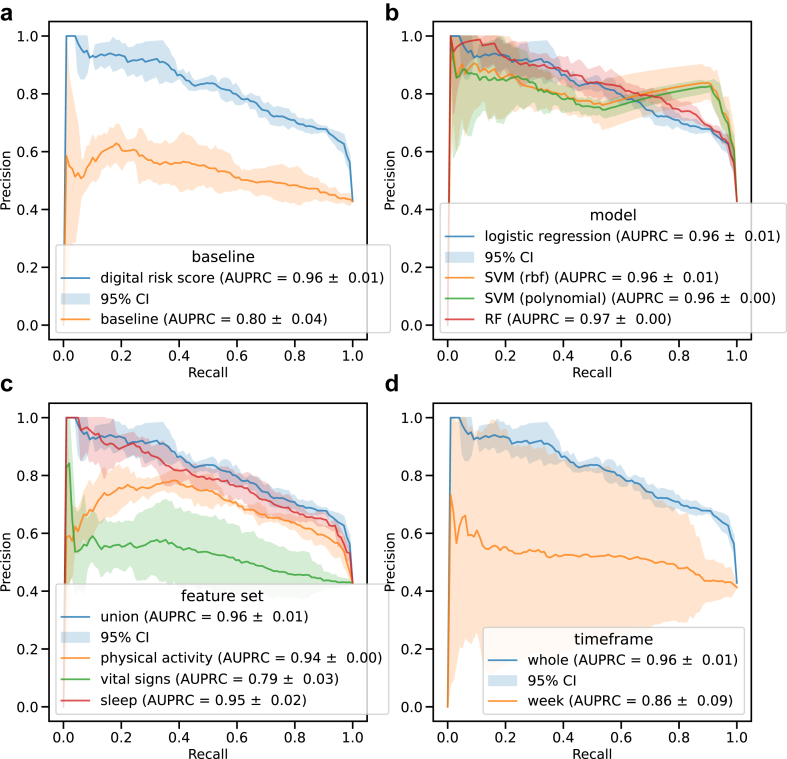
Methods: Here, we combined clinical and biological data from the Parkinson's Progression Marker Initiative (PPMI) cohort with long-term (mean: 485 days) at-home digital monitoring data collected using the Verily Study Watch. We derived a digital risk score based on sleep, vital signs, and physical activity features to distinguish between PD (N = 143) and healthy controls (N = 34), achieving an area under precision-recall curve of 0.96 ± 0.01. We compared it with the Movement Disorder Society (MDS) research criteria for prodromal PD to detect dopaminergic deficit or α-synuclein aggregation in an at-risk cohort consisting of people with genetic markers or prodromal symptoms without a diagnosis of PD (N = 109, mean age = 64.62 ± 6.86, 40 men and 69 women).
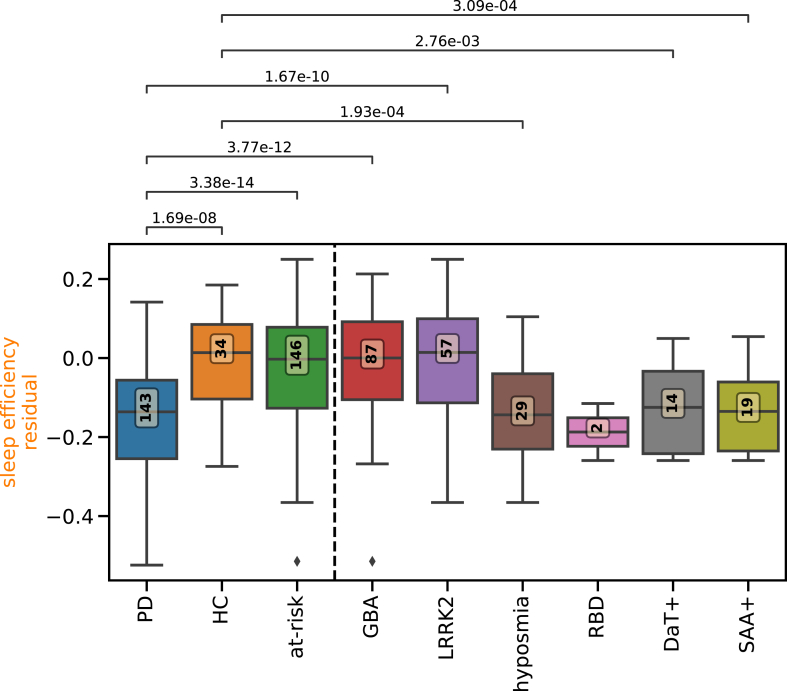
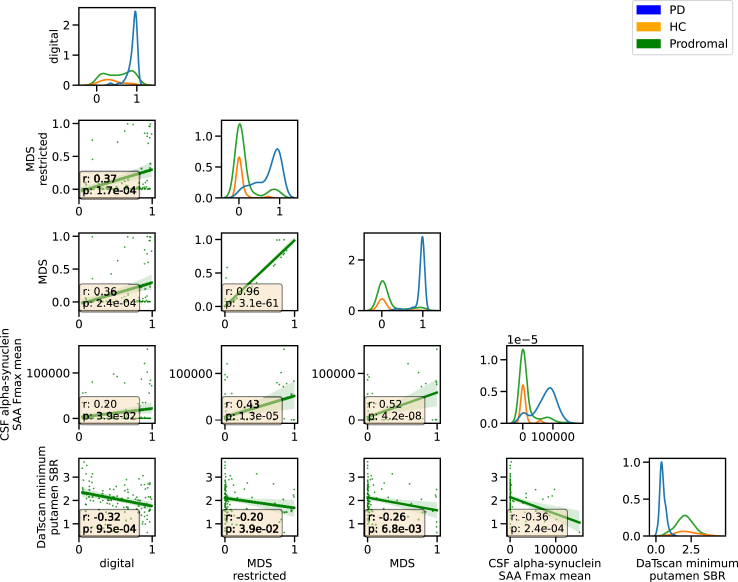
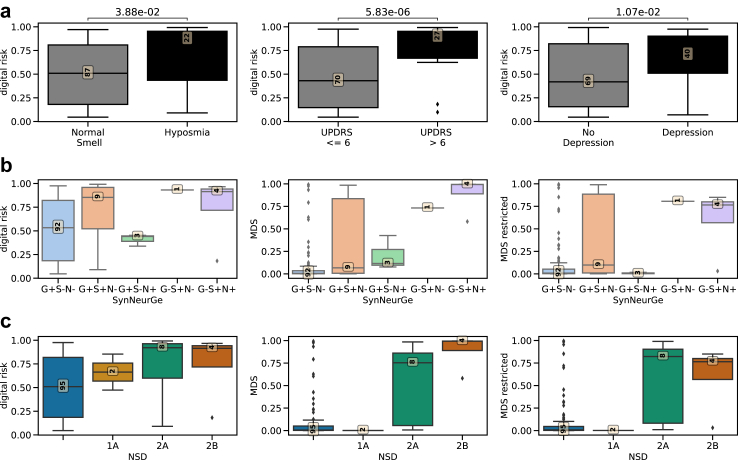
Findings: The digital risk correlated with the MDS research criteria (r = 0.36, p-value = 1.46 × 10⁻⁴) and was increased in individuals with subthreshold Parkinsonism (p-value = 4.99 × 10⁻⁶) and hyposmia (p-value = 3.77 × 10⁻²). The digital risk was correlated to a stronger degree with DaTscan putamen binding ratio (r = -0.32, p-value = 6.64 × 10⁻⁴) than the MDS criteria (r = -0.19, p-value = 6.81 × 10⁻³) but to a weaker degree with SAA (r = 0.2, p-value = 3.9 × 10⁻²) than the MDS (r = 0.43, p-value = 1.3 × 10⁻⁵). The digital risk score achieved higher sensitivity in identifying synucleinopathy or neurodegeneration (0.59) than the MDS score (0.35) but performed on-par with hyposmia (0.59) with a combination of hyposmia and digital risk score achieving the highest sensitivity (0.71). The digital risk score showed lower precision (0.18) than other models.
Interpretation: A digital risk score from smartwatch data should be further explored as a possible first sensitive screening tool for presence of α-synuclein aggregation or dopaminergic deficit followed by subsequent more specific tests to reduce false positives.
Funding: This project is funded by Welsh Government through Health and Care Research Wales, Medical Research Council (MRC), Higher Education Funding Council for Wales, UK Dementia Research Institute, Alzheimer's Society and Alzheimer's Research UK, Dementia Platforms UK, UKRI Engineering and Physical Sciences Research Council (EPSRC), NIHR Imperial Biomedical Research Centre (BRC), Great Ormond Street Hospital and the Royal Academy of Engineering, Edmond J. Safra Foundation, Ser Cymru II programme, and the European Regional Development Fund.
Keywords: Parkinson's disease; Prodromal; Risk modelling; Smartwatch.
Copyright © 2025 The Author(s). Published by Elsevier B.V. All rights reserved.
Conflict of interest statement
Declaration of interests All authors declare no competing interests.
Figures
References
-
- Fearnley J.M., Lees A.J. Ageing and Parkinson's disease: substantia nigra regional selectivity. Brain. 1991;114(Pt 5):2283–2301. - PubMed
-
- Berg D., Postuma R.B., Adler C.H., et al. MDS research criteria for prodromal Parkinson's disease. Mov Disord. 2015;30(12):1600–1611. - PubMed
-
- Heinzel S., Berg D., Gasser T., et al. Update of the MDS research criteria for prodromal Parkinson's disease. Mov Disord. 2019;34(10):1464–1470. - PubMed
-
- Mahlknecht P., Gasperi A., Djamshidian A., et al. Performance of the Movement Disorders Society criteria for prodromal Parkinson's disease: a population-based 10-year study. Mov Disord. 2018;33(3):405–413. - PubMed
MeSH terms
Substances
LinkOut - more resources
Full Text Sources
Medical
Research Materials
Miscellaneous
