Clinical Trial
. 2025 Jun 17;6(6):102154.
doi: 10.1016/j.xcrm.2025.102154. Epub 2025 Jun 5.

Proteogenomic analysis of the CALGB 40601 (Alliance) HER2+ breast cancer neoadjuvant trial reveals resistance biomarkers

Affiliations
Clinical Trial

Proteogenomic analysis of the CALGB 40601 (Alliance) HER2+ breast cancer neoadjuvant trial reveals resistance biomarkers

Eric J Jaehnig et al. Cell Rep Med. .

Abstract

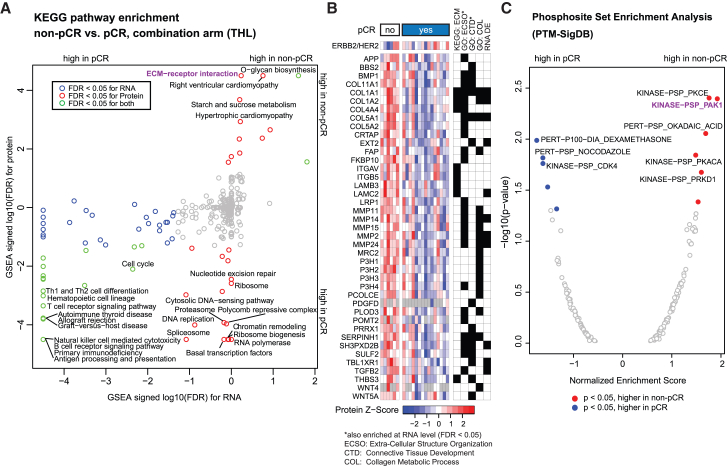
Proteogenomic analysis is applied to samples from the CALGB 40601 (Alliance) randomized neoadjuvant trial of trastuzumab, lapatinib, or the combination to identify biomarkers associated with pathological response status. Absence of ERBB2 gene amplification and human epidermal growth factor receptor 2 (HER2) protein overexpression by proteogenomics is associated with non-pathological compete response (pCR) (p < 0.05), highlighting potential false positives from standard diagnostics. Pathway analysis in proteogenomics-confirmed HER2+ samples identifies elevated epithelial-mesenchymal transition (EMT) and WNT-β-catenin signaling in non-pCR cases before treatment. Twenty-four pCR-associated proteins reproduce in a second proteomic dataset, and four (GPRC5A, TPBG, SP140L, and NEU1) are significant in a third. A meta-analysis of ten diverse neoadjuvant anti-HER2 treatment regimens from four independent studies confirms that non-pCR cases express higher levels of mRNA for G protein-coupled receptor class C group 5 member A (GPRC5A, p = 0.0002) and trophoblast glycoprotein (TPBG, p = 0.00008). Thus, proteogenomic analysis identifies negative biomarkers for pCR and alternative plasma membrane targets for treatment-resistant HER2+ breast cancer. This trial is registered at clinicaltrials.gov (NCT00770809).

Keywords: GPRC5A; HER2+; TPBG; anti-HER2 treatment; breast cancer; clinical trial; meta-analysis; neoadjuvant; proteogenomics; resistance.


Conflict of interest statement

Declaration of interests M.J.E. and C.M.P. are equity stockholders and consultants for Bioclassifier LLC. C.M.P. and M.J.E. are listed as inventors on issued and pending patents for the PAM50 subtyping assay. S.A.C. is a member of the scientific advisory boards of Kymera, PTM Biolabs, and Seer. M.A.G. and S.A.C. are members of the scientific advisory board of PrognomiQ. S.S. is currently employed by AstraZeneca, and AstraZeneca has no role in this study. M.A. and B.Z. received research funding from AstraZeneca, which played no role in this study, and B.Z. is a consultant for AstraZeneca and Inotiv. S.M.K. is a stakeholder in NeoZenome Therapeutics Inc. E.J.J., S.A.C., M.J.E., M.A.G., B.Z., and S.S. are co-inventors on a pending patent US20220326241A1 (Compositions and methods for treating cancer) from a previous HER2-focused study (Satpathy et al., 2020). M.J.E. was a full-time employee at AstraZeneca between March 2002 and March 2024 and is currently employed by Guardant Health, which had no role in this study.

Figures

None
Graphical abstract
Figure 1
Figure 1
Proteogenomic profiling of fresh frozen core biopsies from CALGB40601 (A) REMARK diagram relating the final set of core biopsies processed for proteogenomics to the original clinical trial. See also Table S1. (B) Heatmap showing proteogenomic data availability, clinical data, and proteogenomic features of genes on the ERBB2 amplicon. The data types obtained for each of the 80 biopsies profiled from 54 patients (genomics: DNA sequencing, transcriptomics: RNA-seq, TMT: proteomics [including phosphoproteomics]) are indicated in black (included) and gray (not available). Because two core biopsies were obtained from the same patient in several cases (technical replicates), biopsies from different patients are separated by spaces. PAM50 subtype assignment based on the RNA data obtained in this study (PAM50, updated) as well as from previous RNA profiling (PAM50, original) and Herceptest IHC scores are also shown. Purple boxes outline samples with HER2 protein levels in the lower 5% relative to the pCR distribution (see Figure S1G). (C) Scatterplot showing the correlation between ERBB2 copy-number aberration (CNA) log2 ratios and HER2 protein levels for all biopsies. Spearman correlation rho = 0.57, p = 1.3 × 10⁻⁶. (D and E) Comparison of centralized Herceptest IHC scores with ERBB2 CNA log2 ratios (D) and HER2 protein log2 TMT ratios (E). Boxplots show the median (center) and first (upper bound) and third (lower bound) quartiles for each group, while whiskers indicate 1.5× interquartile range (IQR). White dots show values from biopsies from non-pCR tumors whereas blue dots show values for pCR biopsies. p values are from Wilcoxon rank-sum tests comparing values in biopsies with central ERBB2 IHC scores of 0 and 1+ to those with IHC scores of 2+ or 3+. For (C)–(E), CNA and protein measurements from individual biopsies were treated as separate data points even when obtained from the same patient. See also Figures S1 and S2 and Table S2.
Figure 2
Figure 2
ECM-related pathways are higher in non-pCR than in pCR in the THL arm (A) Scatterplot showing GSEA results for enrichment of KEGG pathways (Table S4) using the signed log10 p values from the linear models comparing non-pCR to pCR in the THL arm for the protein data (y axis) vs. RNA data (x axis) as inputs (Table S3). The top pathway enriched specifically with proteins higher in non-pCR than pCR, “ECM-receptor interaction,” is labeled purple. (B) Heatmap showing significantly differential proteins (p < 0.05 in moderated t tests from linear models comparing non-pCR to pCR in THL arm; Table S3) from the top ECM-related enriched pathways from KEGG and GO BP. Each column represents a separate tumor; when two biopsies were available for the same tumor; mean log2 TMT ratios were calculated prior to Z score scaling. Checker plot on the right indicates whether (black) or not (white) each gene/protein is a member of each pathway or was significantly differential at the RNA level (RNA DE). (C) Volcano plot of PTM-SEA results from enrichment of differential phosphosites in the THL combination arm with phosphosite sets from PTMSigDB (Table S4), using signed (by direction of DE) log10 p values from the linear models as input (Table S3). See also Figure S3.
Figure 3
Figure 3
Immune-related pathways are elevated in tumors demonstrating pCR to trastuzumab (A) Scatterplot showing GSEA results for enrichment of MSigDB Hallmark50 pathways (Table S4) using the signed log10 p values from the THL + TH contrasts from protein data (y axis) vs. RNA data (x axis) as inputs (Table S3). (B) Volcano plot showing PTM-SEA results for PTMSigDB sets (Table S4) using signed log10 p values from comparing phosphosites in non-pCR to pCR (Table S3). y axis shows −log10 p values from PTM-SEA whereas the x axis shows the corresponding normalized enrichment score (NES). (C) Heatmap illustrating immune microenvironment-related proteogenomic features in each tumor (mean of pairs for duplicate biopsies/technical replicates from same tumor) from the THL and TL arms. Features include Z scores of single-sample gene set enrichment analysis (ssGSEA) enrichment scores for immune Hallmark pathways that were differential at the protein level in (A); of mean levels of immune modulator proteins curated by Thorsson et al.; of RNA-based immune signature scores from ESTIMATE, Cibersort, and xCell,,; of the IgG signature previously found to be associated with pCR in this study; of RNA, protein, and phosphoprotein (mean of all sites) levels for immune checkpoint inhibitor (ICI) targets; and of a differential protein-based immune signature from Bayes DeBulk (Tables S2 and S4). Also included are tumor-infiltrating CD3+ cell classifications for each tumor and percentages of T cells based on anti-CD3 immunohistochemistry (IHC) for all available cases. Samples are ordered by increasing levels of protein-based total immune modulator scores. Gray boxes indicate data not available, and asterisks indicate features that were differential in Wilcoxon rank-sum tests comparing non-pCR to pCR using the values for single cores or the mean values for pairs of duplicate cores from the same tumor (p < 0.05). See also Figure S3A.
Figure 4
Figure 4
GPRC5A, TPBG, NEU1, and SP140L protein levels are associated with lack of pCR to neadjuvant anti-HER2 therapy in three proteomics datasets (A) Analogous limma models to those described in Figure S3A were applied to the DP1 study after excluding potential false-positive protein outliers. The Venn diagrams show the overlap between upregulated (top) and downregulated (bottom) proteins from the comparison of non-pCR to pCR for the THL + TH arms of the current study and the DP1 study (limma moderated t test, p < 0.05). Numbers included for each study in parentheses indicate numbers of differential proteins among the 8,488 proteins evaluated by both studies. p values for overlap are from hypergeometric tests evaluating the probability that the overlapping sets contain as many proteins as observed here by chance given the numbers of differential proteins for each study and the background of 8,488 proteins. (B) Heatmap showing protein levels in biopsies (duplicate biopsies from same tumor are included as separate samples) from the THL + TH arms in the current study and from the DP1 study for candidates identified by the workflow described in (A). Upper panel shows 15 proteins that had significantly higher expression in non-pCR than in pCR, and lower panel shows the nine proteins that were higher in pCR (limma moderated t test, p < 0.05). Asterisks indicate genes that were also significant in the current RNA dataset from CALGB 40601. (C) Comparison of non-pCR to pCR samples from a recently published proteomics dataset for tumors from patients treated with dual antibody therapy revealed that GPRC5A (top), TPBG (middle), and NEU1 (bottom) proteins were also significantly elevated in and the SP140L protein was significantly lower in non-pCR in that study as well. Boxplots show the median (center) and first (upper bound) and third (lower bound) quartiles of respective levels of each protein in pCR and non-pCR tumors. p values are from using Wilcoxon rank-sum tests comparing the two groups. (D) TPBG IHC of control sections. Positive controls include placenta and renal cell carcinoma (RCC) tissue and MCF7 cells, while the negative control is the RAJI cell line (a human lymphoblastoid cell line). 100 micron scale bar in the upper left image applies to all images in the panel. (E) TPBG IHC of representative sections from tumors from the CALGB 40601 trial for each ordinal score category (0, 1 ,2, 3). 100 micron scale bar in the upper left image applies to all images in the panel. (F) Comparison of mass spectroscopy data for TPBG protein (y axis) to IHC scores. Boxplots show the median (center) and first (upper bound) and third (lower bound) quartiles of TPBG protein log2 TMT ratios for each group (tumors scoring as 2 or 3 vs. those scoring as 0 and 1), and whiskers extend to 1.5× interquartile range (IQR). For tumors with duplicate biopsies, the mean TPGB log2 TMT ratio was used. p value is from Wilcoxon rank-sum test comparing these groups. See also Tables S2 and S3.
Figure 5
Figure 5
GPRC5A and TPBG gene expression is associated with non-pCR to neadjuvant anti-HER therapy in combination with chemotherapy in multiple clinical trial datasets (A) Heatmap summarizing the results from comparing non-pCR/residual disease (RD) to pCR in publicly available datasets from clinical trials where patients were treated with anti-HER2 therapies. p values are from Wilcoxon rank-sum tests, while log2 FC (fold change) is the difference in the log10 transformed median expression value for the RD and pCR groups. The anti-HER2 therapy for each treatment arm is indicated in the first set of boxes. The pie charts in the meta-analysis column summarize the combined number of samples included in the datasets by pCR status and anti-HER2 therapy. The Stouffer meta-p values show the p values resulting from combination of the individual p values for each dataset weighted by sample size of the corresponding treatment arm using Stouffer’s method. Weighted (by study size) means of the log2 fold changes from the comparison for non-pCR to pCR for each dataset are also included. (B) Receiver-operator characteristic (ROC) curves for classifying tumors as pCR vs. non-pCR/RD using Z scores for HER2, ESR1, GPRC5A, and TPBG gene expression (RNA) in the combination of arms treated with trasuzumab from CHER-LOB (left) or from I-SPY2 (middle) or the HER2+ samples from the neratinib-treated arm from I-SPY2 (right). GPRC5A+TPBG-ERBB2 shows the results for a combined score obtained by adding the Z scores for GPRC5A and TPBG in a given tumor and subtracting the HER2 Z score. Numbers in the legend show the AUROCs for each score. See also Figures S4 and S5 and Table S5.

References

    1. Howlader N., Altekruse S.F., Li C.I., Chen V.W., Clarke C.A., Ries L.A.G., Cronin K.A. US incidence of breast cancer subtypes defined by joint hormone receptor and HER2 status. J. Natl. Cancer Inst. 2014;106 doi: 10.1093/jnci/dju055. - DOI - PMC - PubMed
    1. Cortazar P., Zhang L., Untch M., Mehta K., Costantino J.P., Wolmark N., Bonnefoi H., Cameron D., Gianni L., Valagussa P., et al. Pathological complete response and long-term clinical benefit in breast cancer: the CTNeoBC pooled analysis. Lancet. 2014;384:164–172. doi: 10.1016/S0140-6736(13)62422-8. - DOI - PubMed
    1. Harbeck N. Neoadjuvant and adjuvant treatment of patients with HER2-positive early breast cancer. Breast. 2022;62:S12–S16. doi: 10.1016/j.breast.2022.01.006. Suppl 1. - DOI - PMC - PubMed
    1. Carey L.A., Berry D.A., Cirrincione C.T., Barry W.T., Pitcher B.N., Harris L.N., Ollila D.W., Krop I.E., Henry N.L., Weckstein D.J., et al. Molecular Heterogeneity and Response to Neoadjuvant Human Epidermal Growth Factor Receptor 2 Targeting in CALGB 40601, a Randomized Phase III Trial of Paclitaxel Plus Trastuzumab With or Without Lapatinib. J. Clin. Oncol. 2016;34:542–549. doi: 10.1200/JCO.2015.62.1268. - DOI - PMC - PubMed
    1. Fernandez-Martinez A., Krop I.E., Hillman D.W., Polley M.Y., Parker J.S., Huebner L., Hoadley K.A., Shepherd J., Tolaney S., Henry N.L., et al. Survival, Pathologic Response, and Genomics in CALGB 40601 (Alliance), a Neoadjuvant Phase III Trial of Paclitaxel-Trastuzumab With or Without Lapatinib in HER2-Positive Breast Cancer. J. Clin. Oncol. 2020;38:4184–4193. doi: 10.1200/JCO.20.01276. - DOI - PMC - PubMed

Publication types

MeSH terms

Associated data