. 2025 Jun 6;11(1):85.
doi: 10.1038/s41537-025-00622-0.

The electroencephalography protocol for the Accelerating Medicines Partnership® Schizophrenia Program: Reliability and stability of measures

Daniel H Mathalon  1   2 Spero Nicholas  3   4 Brian J Roach  3   4 Tashrif Billah  5 Suzie Lavoie  6   7 Thomas Whitford  6   8 Holly K Hamilton  9   10 Lauren Addamo  6   7 Andrey Anohkin  11 Tristan Bekinschtein  12 Aysenil Belger  13   14 Kate Buccilli  6   7 John Cahill  15 Ricardo E Carrión  16   17 Stefano Damiani  18 Ilvana Dzafic  6   7 Bjørn H Ebdrup  19   20 Igor Izyurov  21 Johanna Jarcho  22 Raoul Jenni  23 Anna Jo  24 Sarah Kerins  25 Clarice Lee  6   7 Elizabeth A Martin  26 Rocio Mayol-Troncoso  27   28 Margaret A Niznikiewicz  29   30 Muhammad Parvaz  31   32 Oliver Pogarell  33 Julio Prieto-Montalvo  34 Rachel Rabin  35   36 David R Roalf  37 Jack Rogers  38   39 Dean F Salisbury  40 Riaz Shaik  31 Stewart Shankman  41 Michael C Stevens  15   42 Yi Nam Suen  43 Nicole C Swann  44 Xiaochen Tang  45 Judy L Thompson  46 Ivy Tso  47 Julian Wenzel  48 Juan Helen Zhou  49   50 Jean Addington  51 Luis Alameda  52   53 Celso Arango  34 Nicholas J K Breitborde  47 Matthew R Broome  38   54 Kristin S Cadenhead  55 Monica E Calkins  37 Rolando I Castillo-Passi  27   56 Eric Yu Hai Chen  57 Jimmy Choi  42 Philippe Conus  52 Cheryl M Corcoran  31 Barbara A Cornblatt  16   17 Covadonga M Diaz-Caneja  34 Lauren M Ellman  22 Paolo Fusar-Poli  18   53 Pablo A Gaspar  27 Carla Gerber  58   59 Louise Birkedal Glenthøj  60   61 Leslie E Horton  40 Christy Lai Ming Hui  57 Joseph Kambeitz  48 Lana Kambeitz-Ilankovic  33   48 Matcheri S Keshavan  62 Minah Kim  63   64 Sung-Wan Kim  24   65 Nikolaos Koutsouleris  33   53 Jun Soo Kwon  66 Kerstin Langbein  21 Daniel Mamah  67 Vijay A Mittal  68 Merete Nordentoft  20   60 Godfrey D Pearlson  15   69 Jesus Perez  70   71 Diana O Perkins  13 Albert R Powers  15   72 Fred W Sabb  58 Jason Schiffman  26 Jai L Shah  36   73 Steven M Silverstein  46 Stefan Smesny  21 William S Stone  62 Gregory P Strauss  74 Rachel Upthegrove  38   75 Swapna K Verma  76   77 Jijun Wang  45 Daniel H Wolf  37 Tianhong Zhang  45 Sylvain Bouix  78 Ofer Pasternak  5   79 Kang-Ik K Cho  5 Michael J Coleman  5 Dominic Dwyer  6   7 Angela Nunez  15   72 Zailyn Tamayo  15 Stephen J Wood  6   7 Rene S Kahn  31 John M Kane  16   17 Patrick D McGorry  6   7 Carrie E Bearden  26   80 Barnaby Nelson  6   7 Scott W Woods  15   72 Martha E Shenton  5   79   81 Accelerating Medicines Partnership® Schizophrenia ProgramGregory A Light  55   82
Affiliations

The electroencephalography protocol for the Accelerating Medicines Partnership® Schizophrenia Program: Reliability and stability of measures

Daniel H Mathalon et al. Schizophrenia (Heidelb). .

Abstract

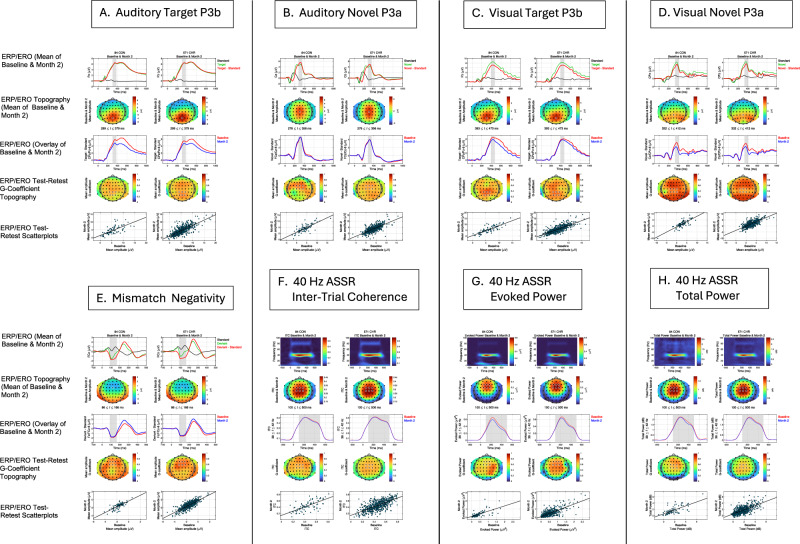
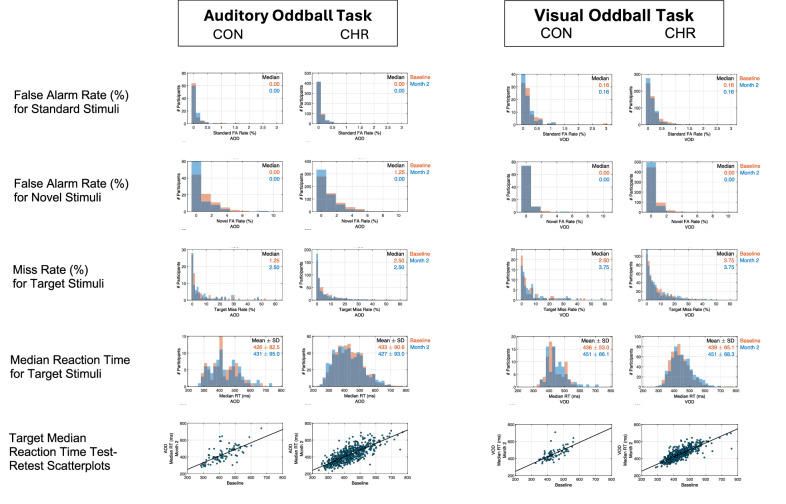
Individuals at clinical high risk for psychosis (CHR) have variable clinical outcomes and low conversion rates, limiting development of novel and personalized treatments. Moreover, given risks of antipsychotic drugs, safer effective medications for CHR individuals are needed. The Accelerating Medicines Partnership® Schizophrenia (AMP® SCZ) Program was launched to address this need. Based on past CHR and schizophrenia studies, AMP SCZ assessed electroencephalography (EEG)-based event-related potential (ERP), event-related oscillation (ERO), and resting EEG power spectral density (PSD) measures, including mismatch negativity (MMN), auditory and visual P300 to target (P3b) and novel (P3a) stimuli, 40-Hz auditory steady state response, and resting EEG PSD for traditional frequency bands (eyes open/closed). Here, in an interim analysis of AMP SCZ EEG measures, we assess test-retest reliability and stability over sessions (baseline, month-2 follow-up) in CHR (n = 654) and community control (CON; n = 87) participants. Reliability was calculated as Generalizability (G)-coefficients, and changes over session were assessed with paired t-tests. G-coefficients were generally good to excellent in both groups (CHR: mean = 0.72, range = 0.49-0.85; CON: mean = 0.71, range = 0.44-0.89). Measure magnitudes significantly (p < 0.001) decreased over session (MMN, auditory and visual target P3b, visual novel P3a, 40-Hz ASSR) and/or over runs within sessions (MMN, auditory/visual novel P3a and target P3b), consistent with habituation effects. Despite these small systematic habituation effects, test-retest reliabilities of the AMP SCZ EEG-based measures are sufficiently strong to support their use in CHR studies as potential predictors of clinical outcomes, markers of illness progression, and/or target engagement or secondary outcome measures in controlled clinical trials.


Conflict of interest statement

Competing interests: The authors declare the following competing interests: B.H.E. is part of the Advisory Board of Boehringer Ingelheim, Lundbeck Pharma A/S; and has received lecture fees from Boehringer Ingelheim, Otsuka Pharma Scandinavia AB, and Lundbeck Pharma A/S; C.A. has been a consultant to or has received honoraria or grants from Acadia, Angelini, Biogen, Boehringer, Gedeon Richter, Janssen Cilag, Lundbeck, Medscape, Menarini, Minerva, Otsuka, Pfizer, Roche, Sage, Servier, Shire, Schering Plough, Sumitomo Dainippon Pharma, Sunovion and Takeda; C.D.C. has received grant support from Instituto de Salud Carlos III, Spanish Ministry of Science and Innovation and honoraria or travel support from Angelini, Janssen, and Viatris; C.M.C. is an Associate Editor of Nature: Schizophrenia; D.D. has received honorary funds for one educational seminar for CSL Sequiris; D.O.P. has been a consultant to Alkermes; E.Y.H.C. has received speaker fees at non-promotional educational events; GAL has been a consultant for Bristol Myers Squibb, Cerevel, Johnson & Johnson, Neurocrine, NeuroSig, and Sosei-Heptares; J.K. has received speaking or consulting fees from Janssen, Boehringer Ingelheim, ROVI and Lundbeck; J.M.K. is a consultant to or receives honoraria and/or travel support and/or speakers fees from Alkermes, Allergan, Boehringer-Ingelheim, Cerevel, Dainippon Sumitomo, H. Lundbeck, HealthRhythms, HLS Therapeutics, Indivior, Intracellular Therapies, Janssen Pharmaceutical, Johnson & Johnson, Karuna Therapeutics/Bristol Myers Squibb, LB Pharmaceuticals, Mapi, Maplight, Merck, Minerva, Neurocrine, Newron, Novartis, NW PharmaTech, Otsuka, Roche, Saladax, Sunovion, and Teva; and is on Advisory Boards for Alkermes, Boehringer-Ingelheim, Cerevel, Click Therapeutics, Karuna/BMS, Lundbeck, Merck, Newron, Novartis, Otsuka, Sumitomo, Teva, and Terran; and has received grant support from Lundbeck, Janssen, Otsuka, and Sunovion; and has shareholder interest in Cerevel (public/stock), HealthRhythms (private/stock options), Karuna/BMS (public), LB Pharmaceuticals (private/stock options), North Shore Therapeutics (private/stock), and Vanguard Research Group (private/40% owner); P.F.P. has received research funds or personal fees from Lundbeck, Angelini, Menarini, Sunovion, Boehringer Ingelheim, Proxymm Science, Otsuka, outside the current study; R.S.K. has been a consultant to Alkermes and Boehringer-Ingelheim; R.U. has received speaker fees at non-promotional educational event: Otsuka: Consultancy for Viatris and Springer Healthcare. Honorary General Secretary British Association for Psychopharmacology (unpaid); S.W.W. has received speaking fees from the American Psychiatric Association and from Medscape Features. He has been granted US patent No. 8492418 B2 for a method of treating prodromal schizophrenia with glycine agonists. He owns stock in NW PharmaTech; and Z.T. has been a consultant for Manifest Technologies. All other authors report no biomedical financial interests or potential conflicts of interest.

Figures

Fig. 1
Fig. 1. Intervals between baseline and month-2 EEG sessions by group.
Frequency distributions of inter-session intervals, in days, between baseline and month-2 EEG sessions, as well as central tendency indicators, are plotted for the full sample (i.e., quality control rating ≥ 2) of community controls (CON) on the left and clinical high risk participants (CHR;) on the right. Mean (orange), median (green), and modal (blue) inter-session intervals (in days) are indicated with colored vertical lines and are presented in the top right corner of each plot. Distributions were skewed to the right, indicating that a minority of participants had longer inter-session intervals. QC quality control.
Fig. 2
Fig. 2. Grand average event-related potential waveforms and event-related oscillation time-frequency maps, scalp topographies, and baseline to month-2 test-retest reliability maps for each task by group.
For each event-related potential (ERP; (A)-Auditory Target P3b, (B)-Auditory Novel P3a, (C)-Visual Target P3b, (D)-Visual Novel P3a, (E)-Mismatch Negativity) or 40-Hz auditory steady state response (ASSR) event-related oscillation (ERO; (F)- Inter-trial Coherence; (G)-Evoked Power; (H)-Total Power) measure, grand average waveforms or time-frequency heat maps, averaged over baseline and month-2 follow-up, from the single scalp electrode (ERP) or fronto-central 6-electrode cluster (ERO) where the measure was most prominent, are shown in row 1. In each case (A-H), community control (CON) results are shown on the left, and clinical high risk (CHR) results are shown on the right. For ERP components (AE): Row 1 shows grand average ERP waveforms for single stimulus types, as well as difference waves between stimulus types. Light gray vertical bars are centered on the ERP component’s peak and indicate the window over which values were averaged to measure the component’s amplitude. Row 2 shows the scalp topography maps for these ERP component amplitudes, averaged over baseline and month-2 assessments. Row 3 shows baseline and month-2 overlays of the grand average ERP difference waves, averaged over the cluster of electrodes where the component is most prominent (e.g., CPz/Pz-6 auditory target P300 represents average of 6 electrodes centered on CPz and Pz, shown also with white circles around included electrodes in G-coefficient topography maps in row 4). For ERO measures from the 40-Hz ASSR paradigm (FH): Row 1 shows time-frequency heat maps for inter-trial coherence (F), evoked power (G), and total power (F). Row 2 shows scalp topography maps for these ERO measures averaged over the 100–500 ms time window and 38–42 Hz frequency band. Row 3 shows baseline and month-2 overlays of the ERO measure's waveform extracted for the 38–42 Hz frequency band. For all ERP and ERO measures (AH): Row 4 shows scalp topography maps of the test-retest Generalizability (G)-coefficients, and white circles around the electrodes indicate the electrodes included in the average measure. Row 5 shows scatterplots of these average measures for month-2 vs. baseline.
Fig. 3
Fig. 3. Auditory and visual oddball task performance and target reaction times for baseline and month-2 by group.
Performance error rates and median target reaction time distributions at baseline and month-2 follow-up are presented for the auditory oddball task (AOD) on the left and the visual oddball task(VOD) on the right. For each task, community controls (CON) are shown on the left, and clinical high risk participants (CHR) are shown on the right. The distributions of false alarm (FA) rates are shown for standard stimuli (row 1) and for novel non-target stimuli (row 2), and the distributions of miss rates for target stimuli are shown in row 3. Overall, these distributions indicate low false alarm and miss rates, as indicated by the median values shown in the right upper corner of the plots. Row 4 shows the distributions of median target reaction times in milleseconds (ms), and their mean values are presented in the right upper corner of the plots. Row 5 shows the month-2 vs. baseline scatterplots of median target reaction times (RT), corresponding to the G-coefficients presented in Table 3.
Fig. 4
Fig. 4. Resting EEG power spectral densities, scalp topographies, and baseline to month-2 test-retest reliability maps by group.
Power spectral density (PSD) plots of resting electroencephalography (EEG) for eyes open (green line) and eyes closed (black line) conditions, averaged over baseline and month-2 follow-up, are presented in row 1 for community controls (CON) on the left and clinical high risk (CHR) participants on the right for conventional EEG frequency bands Delta (A), Theta (B), Alpha (C), Beta (D), and Gamma (E). PSD values are plotted on a log scale. Gray vertical bars indicate the definition of each frequency band. Rows 2 and 3 show the scalp topography maps of PSD for each frequency band (AE) during eyes open and closed conditions, averaged over baseline and month-2 follow-up assessments. White circles indicate the electrodes where the PSD was most prominent. PSD plots averaged over the white circled electrodes in the topography maps are overlaid for baseline and month-2 for eyes open (rows 4) and eyes closed (row 5) conditions. Scalp topography maps of test-retest G-coefficients for PSD values at each frequency band (AE) are shown for eyes open (row 6) and eyes closed (row 7) conditions. White circles indicate electrodes over which PSDs were averaged, and scatterplots of month-2 vs. baseline PSD values, corresponding to the G-coefficients presented in Table 3, are presented for eyes open condition in row 8 and for eyes closed condition in row 9. For these scatterplots, PSD values are plotted on a log scale.
Fig. 5
Fig. 5. ERP component amplitudes by task run and EEG session.
ERP component mean amplitudes and standard error bars are presented by run for baseline and month-2 sessions for mismatch negativity (MMN; N = 546; top row), visual oddball (VOD) novel P3a and target P3b (N = 546; middle row), and auditory oddball (AOD) novel P3a and target P3b (N = 582; bottom row) using clusters of 6 electrodes centered on midline electrodes indicated in each plot (e.g., Fz/FCz-6 cluster comprises mean of electrodes Fz, F1, F2, FCz, FC1, FC2). QC = Quality Control. Included data were for sessions where all runs were completed and where the QC rating for both sessions was ≥ 3.

References

    1. Hartmann, J. A. et al. Declining transition rates to psychotic disorder in ‘ultra-high risk’ clients: Investigation of a dilution effect. Schizophr. Res.170, 130–136 (2016). - PubMed
    1. Lim, K.-O. et al. Early referral and comorbidity as possible causes of the declining transition rate in subjects at clinical high risk for psychosis. Early Interv. Psychiatry12, 596–604 (2018). - PubMed
    1. Nelson, B. et al. Further examination of the reducing transition rate in ultra high risk for psychosis samples: The possible role of earlier intervention. Schizophr. Res.174, 43–49 (2016). - PubMed
    1. Yung, A. R. et al. Declining transition rate in ultra high risk (prodromal) services: dilution or reduction of risk?. Schizophr. Bull.33, 673–681 (2007). - PMC - PubMed
    1. Formica, M. J. C. et al. Has improved treatment contributed to the declining rate of transition to psychosis in ultra-high-risk cohorts?. Schizophr. Res.243, 276–284 (2022). - PubMed

LinkOut - more resources