. 2025 Jun 6;16(1):5260.
doi: 10.1038/s41467-025-60334-y.

Cholangiocytes contribute to hepatocyte regeneration after partial liver injury during growth spurt in zebrafish

Affiliations

Cholangiocytes contribute to hepatocyte regeneration after partial liver injury during growth spurt in zebrafish

Sema Elif Eski et al. Nat Commun. .

Abstract

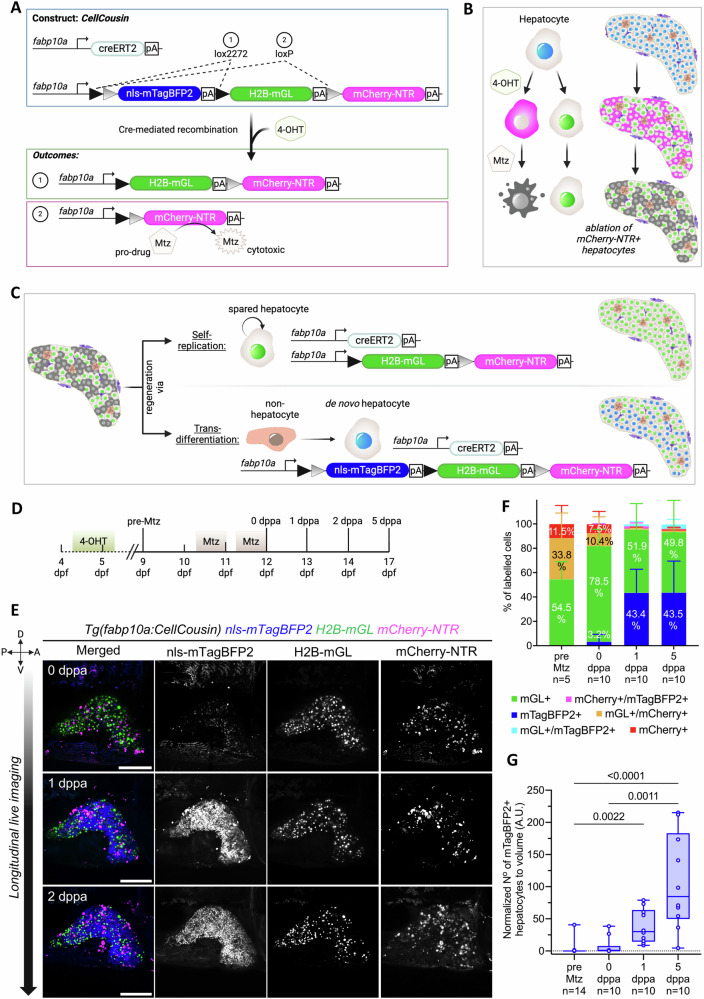
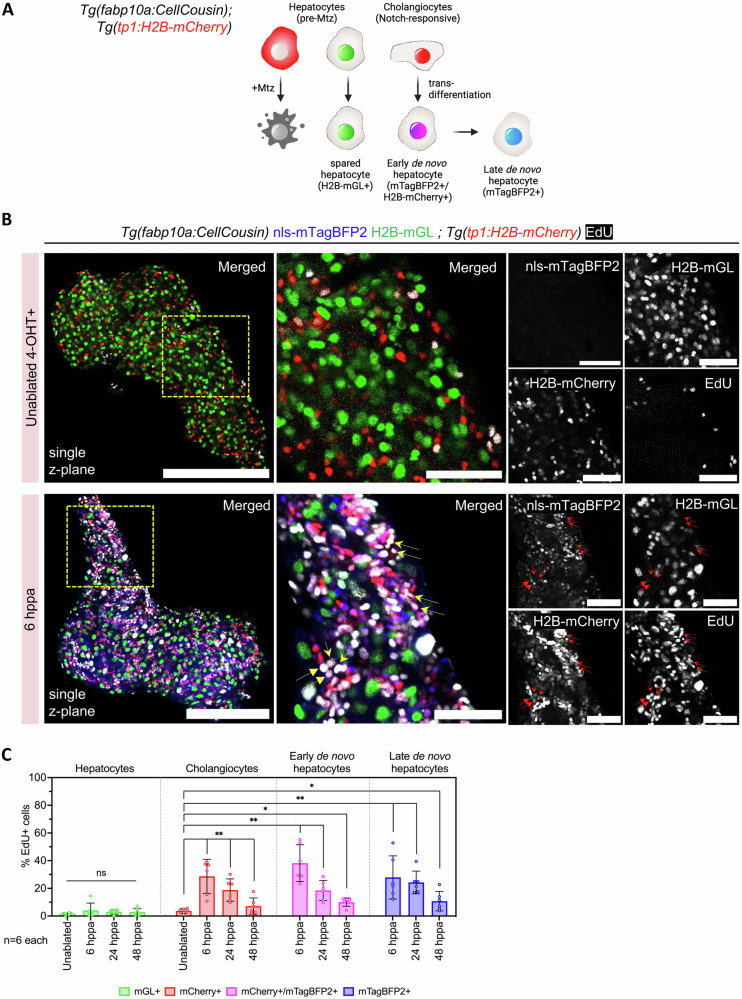
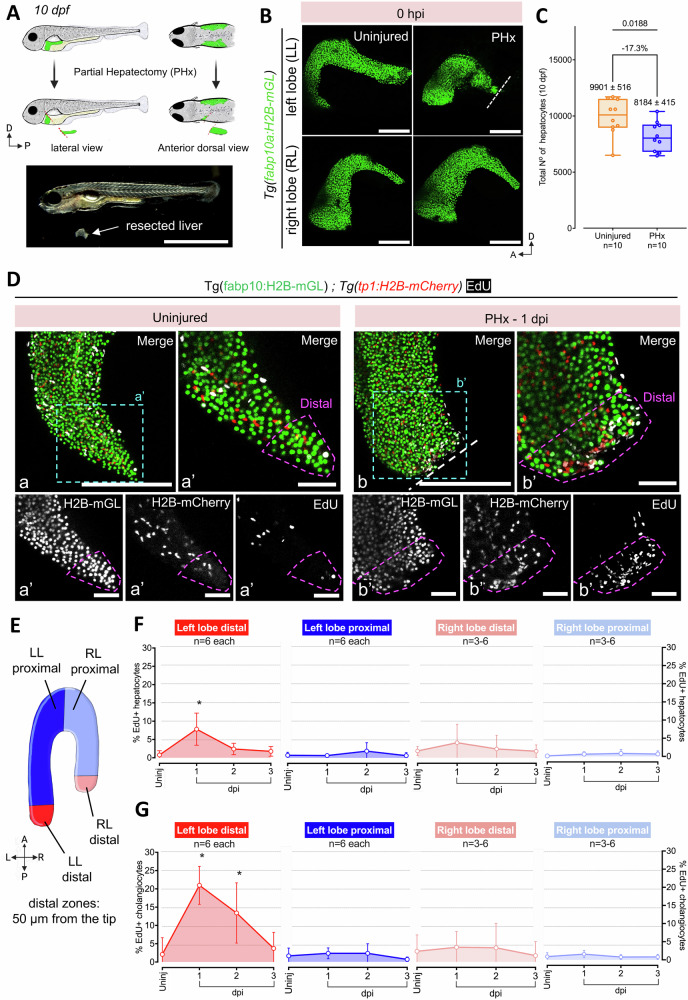
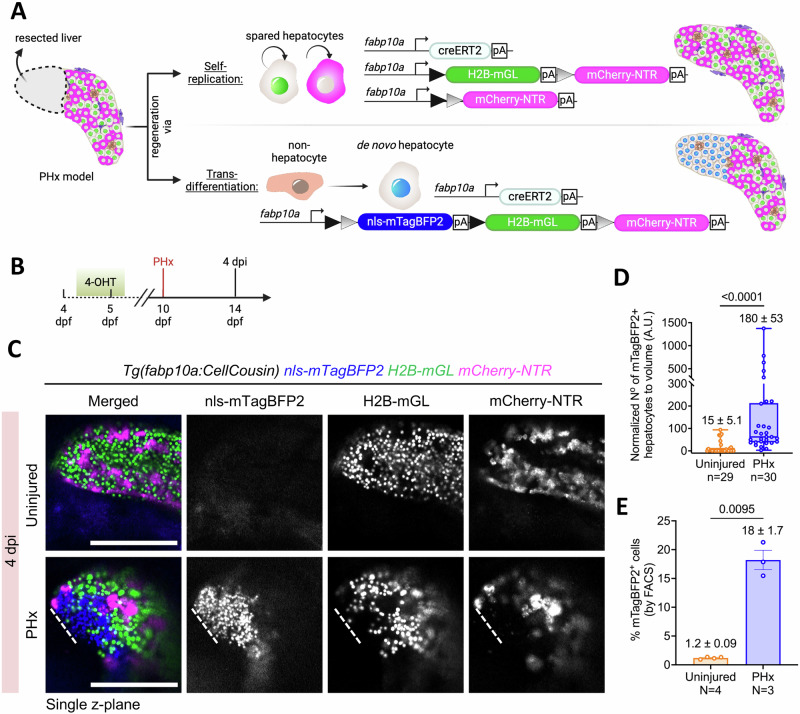
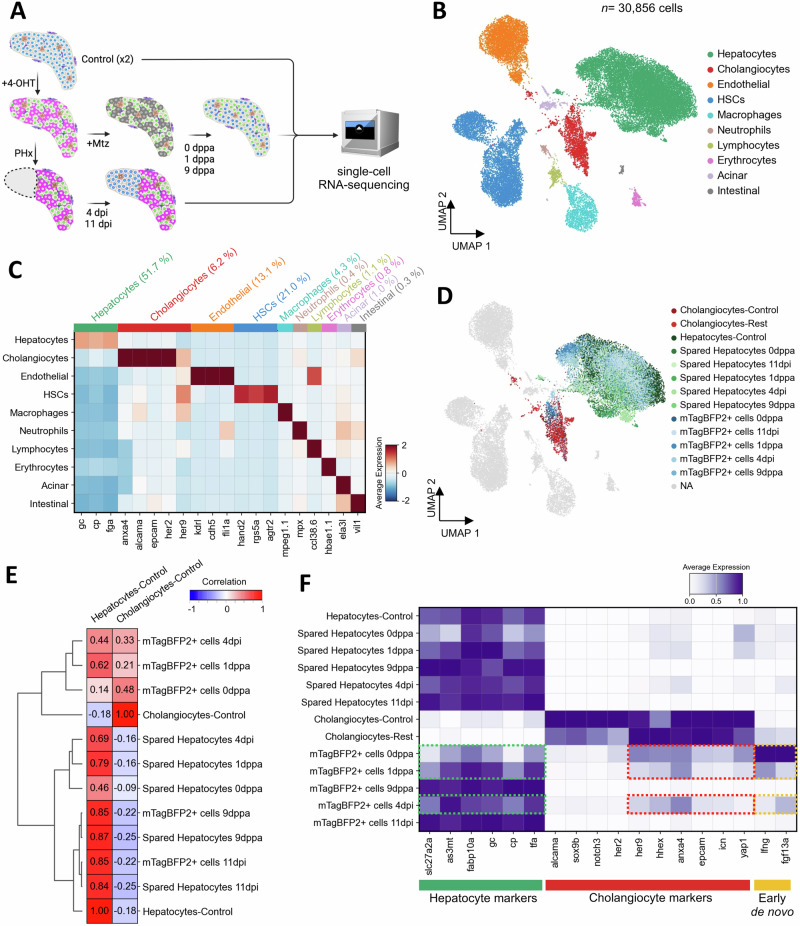
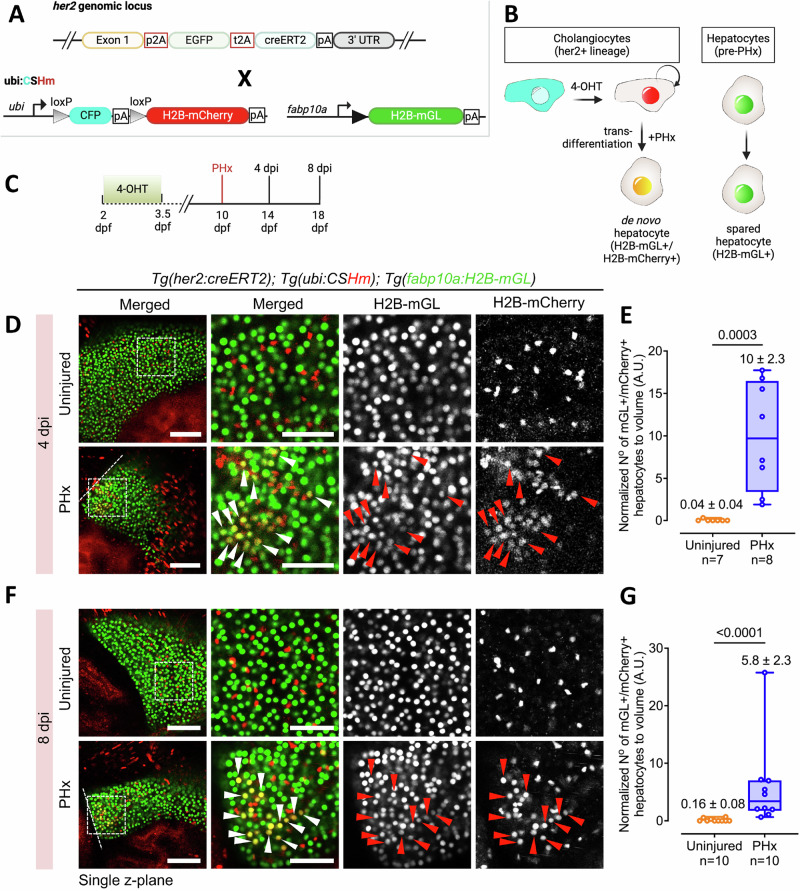
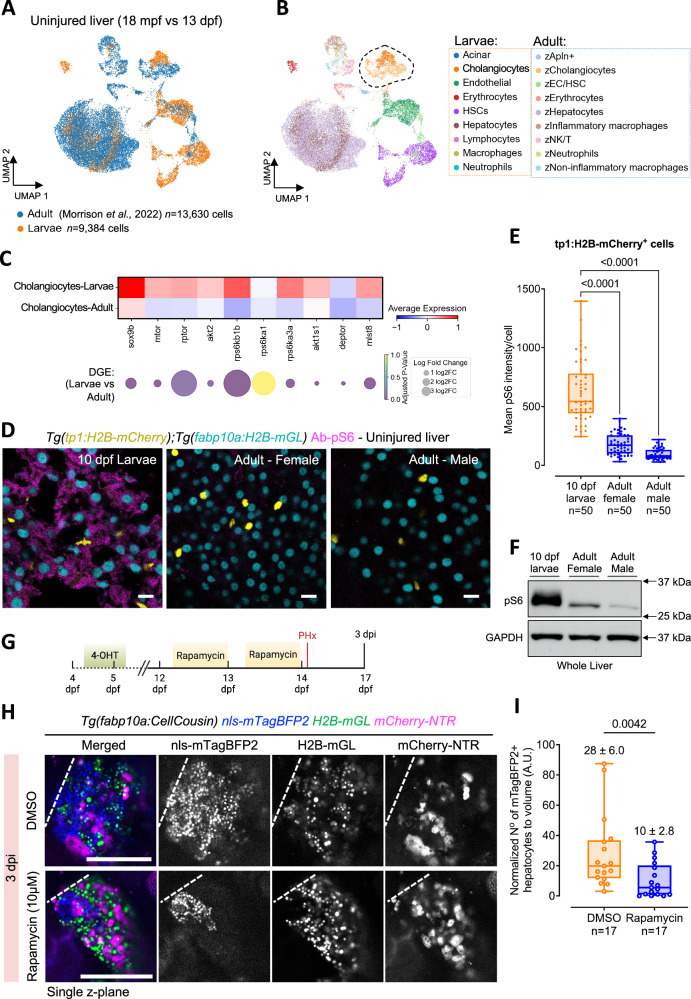
The liver's regenerative ability depends on injury extent. Minor injuries are repaired by hepatocyte self-duplication, while severe damage triggers cholangiocyte involvement in hepatocyte recovery. This paradigm is well-documented for adult animals but is less explored during rapid growth. We design two partial liver injury models in zebrafish, which were investigated during growth spurts: 1) partial ablation, killing half the hepatocytes; and 2) partial hepatectomy, removing half a liver lobe. In both injuries, de novo hepatocytes emerged alongside existing ones. Single-cell transcriptomics and lineage tracing with Cre-driver lines generated by genome editing identified cholangiocytes as the source of de novo hepatocytes. We further identify active mTORC1 signalling in the uninjured liver of growing animal to be a regulator of the enhanced plasticity of cholangiocytes. Our study suggests cholangiocyte-to-hepatocyte transdifferentiation as the primary mechanism of liver regeneration during periods of rapid growth.


Conflict of interest statement

Competing interests: The authors declare no competing interests.

Figures

Fig. 1
Fig. 1. CellCousin-enabled partial ablation of hepatocytes and subsequent tracking of hepatocyte regeneration.
A Schematic illustrating CellCousin construct for labeling hepatocytes by Cre/lox-mediated-recombination. B Strategy for the ablation of mCherry-NTR-expressing hepatocytes. C Schematic illustration showing the two potential modes of hepatocyte regeneration after partial ablation and the associated fluorescent labeling. D Schematic illustrating the experimental strategy. E Longitudinal in vivo confocal imaging of the same liver at 0, 1 and 2 dppa showing emergence of mTagBFP2+ hepatocytes in presence of spared H2B-mGL+ hepatocytes. Scale bar: 200 μm. F Barplots with mean ± SD of the percentage of hepatocyte labeling before (pre-Mtz, n = 5 animals) and after Mtz treatment (0,1 and 5 dppa, n = 10 animals each). G Min-to-max boxplot showing quantification of normalized number of mTagBFP2+ cells before and after Mtz treatment (pre-Mtz, n = 14 animals; after Mtz treatment (0,1 and 5 dppa), n = 10 animals each) (Kruskal Wallis test).
Fig. 2
Fig. 2. Cholangiocytes proliferate in response to partial ablation of hepatocytes.
A Schematic illustrating the lineage tracing of cholangiocytes after partial ablation via the CellCousin method. Hepatocytes are labeled with H2B-mGL+ or mCherry-NTR+ after 4-OHT treatment in the Tg(fabp10a:CellCousin) line. Cholangiocytes, which are Notch-responsive, are marked with bright H2B-mCherry+ (nuclear red) using the Tg(tp1:H2B-mCherry) line. After MTZ administration, Specific ablation of mCherry-NTR+ hepatocytes leads to a liver with spared H2B-mGL+ hepatocytes and de novo nls-mTagBFP2+ hepatocytes. Early de novo hepatocytes derived from cholangiocytes are detected as nls-mTagBFP2 + /H2B-mCherry+ (nuclear magenta), while late de novo hepatocytes, due to dilution of H2B-mCherry label, are marked only with nls-mTagBFP2. B Confocal images of livers from EdU labeled uninjured and 6 hppa Tg(fabp10a:CellCousin); Tg(tp1:H2B-mCherry) transgenic animals. Arrows mark proliferating early de novo hepatocytes. Scale bar: 200 μm (left panels), 50 μm (insets). C Barplot with Mean ± SD showing quantification of the percentage of EdU+ hepatocytes, cholangiocytes, and early and late de novo hepatocytes in uninjured, 6 dppa, 24 dppa and 48 dppa (n = 6 animals). (ANOVA, followed by pair wise comparison using Two-Tailed Mann Whitney. For cholangiocytes and de novo hepatocytes, comparison with uninjured cholangiocytes is shown. ** p-value = 0.0022; * p-value < 0.05).
Fig. 3
Fig. 3. Establishment of a partial hepatectomy (PHx) model of liver regeneration.
A Schematic illustration (above) and brightfield image (below) showing the surgical procedure for PHx of the left lobe in 10 dpf larvae. B Representative confocal images of the left and right liver lobe from uninjured or 0 hours-post-injury (hpi) PHx Tg(fabp10a:H2B-mGL) animals. Site of resection marked with white dashed line. C Min-to-max boxplot showing quantification of the total number of hepatocytes (nuclei) at 10 dpf in the livers subjected to PHx (n = 10 animals, each) (Two-tailed Welch’s t test). Each dot represents one animal; mean ± SEM is indicated above each box. D Confocal images of livers from EdU labeled Tg(fabp10a:H2B-mGL); Tg(tp1:H2B-mCherry) animals at 11 dpf (uninjured) and 1 dpi. Scale bar: 200 μm (a, b), 50 μm (a’, b’). E Schematic depicting the segregation of the liver lobes into a distal region of 50 μm thickness and a proximal region. F, G Quantification representing Mean ± SD of the percentage of EdU+ hepatocytes (F) and cholangiocytes (G) in uninjured, 1-, 2- and 3-dpi separated by distal and proximal regions of the left (injured) (n = 6 animals each) and right (uninjured) (n = 6, 6, 3, 5 animals, respectively) lobe. (ANOVA followed by Kruskal–Wallis test; *p-value < 0.05).
Fig. 4
Fig. 4. Contribution of de novo hepatocytes to regeneration following partial hepatectomy (PHx).
A Schematic showing the potential modes of regeneration after PHx and the associated fluorescent labeling of hepatocytes. B Experimental strategy for 4-OHT-pulse labeling and PHx in the Tg(fabp10a:CellCousin) background. C Representative confocal images of the left lobe from live imaging of the Tg(fabp10a:CellCousin) animals that were uninjured or subjected to PHx. D Min-to-max boxplot showing quantification of the normalized number of mTagBFP2+ cells in uninjured (n = 29 animals) and PHx animals (n = 30 animals) at 4 dpi (Two-tailed Mann–Whitney test). Each dot represents one animal; mean ± SEM is indicated above each box. Scale bar: 200 μm (B). E Barplot with Mean ± SEM showing quantification of the percentage of mTagBFP2+ hepatocytes using FACS in uninjured (n = 4 biological replicates) and 4 dpi (n = 3 biological replicates) animals (Two-tailed Welch’s t-test). Each dot represents one biological replicate; mean ± SEM is indicated above each box.
Fig. 5
Fig. 5. De novo hepatocytes display transcriptional convergence with uninjured hepatocytes.
A Schematic representation of the single-cell RNA-seq approach to investigate the cellular and transcriptional landscape in basal condition (control-uninjured, N = 2) and during regeneration after partial ablation (0,1,9 dppa) and partial hepatectomy (4, 11 dpi). B UMAP visualization of cell types detected in zebrafish larval liver, combining data from injured and uninjured liver conditions. C Heatmap displaying the average scaled expression of selected markers across different cell types. D UMAP visualization focusing on specific injured conditions, highlighting mTagBFP2+ cells and spared hepatocytes (0,1,9 dppa and 4,11 dpi), control hepatocytes, control cholangiocytes, and cholangiocytes in injured conditions (cholangiocytes-rest). The remaining clusters are shown in gray. E Correlation matrix of hierarchically clustered mTagBFP2+ and spared hepatocytes compared to control hepatocytes and cholangiocytes. F Heatmap showing the normalized expression of hepatocyte and cholangiocyte-specific marker genes. Expression of selected genes that are detected in mTagBFP2+ cells at 0 dppa, 1 dppa and 4 dpi are outlined (dashed rectangles).
Fig. 6
Fig. 6. her2+ cells generate hepatocytes after PHx.
A The transgenic lines used to lineage trace her2+ cells. B Schematic illustrating the tracing of her2 + -derived hepatocytes following PHx. C Experimental timeline for lineage tracing. D, F Live confocal images of left lobe in uninjured and PHx condition at 4 dpi (D) and at 8 dpi (F). Representative cholangiocyte-derived de novo hepatocytes are marked with arrowheads. Dashed line marks the border of the regenerate. E, G Min-to-max box plots showing the normalized number of H2B-mGL+/mCherry+ hepatocytes per unit volume at 4 dpi (E) and 8 dpi (G). Each dot represents one animal; mean ± SEM is indicated above each box. Statistical significance was assessed using the Two-tailed Mann–Whitney test. Sample sizes are indicated below the respective groups. Scale bars: 100 μm (left panels), 50 μm (insets) (D, F).
Fig. 7
Fig. 7. mTORC1 activity in uninjured liver regulates cholangiocyte plasticity during liver regeneration.
A UMAP visualization showing the integration of uninjured zebrafish larval and adult liver cells. B Unsupervised clustering of cell types presents in larval and adult datasets. The dashed area indicates cholangiocytes present in the two datasets. C Heatmap of mTORC1 signaling pathway-related gene expression in larval and adult cholangiocytes (top). Fold changes and p-values from differential gene expression (DGE) analysis displayed in dot plot (bottom). D Immunostaining for pS6 in uninjured larval and adult zebrafish liver sections. Scale bars: 10 μm. E Min-to-max boxplot showing quantification of pS6 intensity in cholangiocytes from livers of uninjured larval and adult zebrafish (n = 50 cells from 10 animals) (ANOVA followed by Kruskal Wallis test). F Western blot against pS6 and GAPDH for whole livers from 10 dpf larvae and adult zebrafish. G Schematic of the experimental approach for inhibiting the mTORC1 signaling pathway in Tg(fabp10a:CellCousin) zebrafish larvae. H Confocal images of the liver from 3 dpi Tg(fabp10a:CellCousin) larvae treated with DMSO or 10 μM Rapamycin. Dashed line marks the border of the regenerate. Scale bars: 200 μm. I Min-to-max boxplot showing quantification of normalized mTagBFP2+ de novo hepatocytes following treatment with Rapamycin treatment (n = 17 animals) compared to DMSO controls (n = 17 animals). Each dot represents one animal; mean ± SEM is indicated above each box. Statistical significance was assessed using the Two-tailed Mann–Whitney test.

Similar articles

References

    1. Font-Burgada, J. et al. Hybrid periportal hepatocytes regenerate the injured liver without giving rise to cancer. Cell162, 766–779 (2015). - PMC - PubMed
    1. Yanger, K. et al. Adult hepatocytes are generated by self-duplication rather than stem cell differentiation. Cell Stem Cell15, 340–349 (2014). - PMC - PubMed
    1. Chembazhi, U. V., Bangru, S., Hernaez, M. & Kalsotra, A. Cellular plasticity balances the metabolic and proliferation dynamics of a regenerating liver. Genome Res31, 576–591 (2021). - PMC - PubMed
    1. Ben-Moshe, S. et al. The spatiotemporal program of zonal liver regeneration following acute injury. Cell Stem Cell29, 973–989.e10 (2022). - PubMed
    1. Malato, Y. et al. Fate tracing of mature hepatocytes in mouse liver homeostasis and regeneration. J. Clin. Invest.121, 4850–4860 (2011). - PMC - PubMed

MeSH terms

Substances

LinkOut - more resources