

The combination of the 18F-FDG PET and susceptibility-weighted imaging for diagnosis of cerebral glucose metabolism and iron deposition in Parkinson's disease
- PMID: 40481012
- PMCID: PMC12144259
- DOI: 10.1038/s41598-025-02672-x
The combination of the 18F-FDG PET and susceptibility-weighted imaging for diagnosis of cerebral glucose metabolism and iron deposition in Parkinson's disease
Abstract
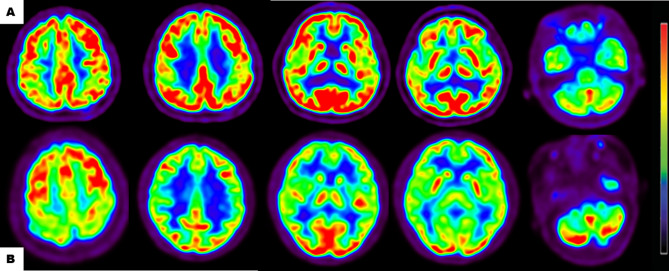
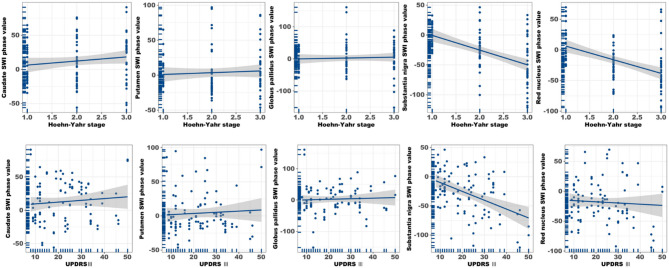
This study aimed to evaluate the diagnostic potential of combining 18F-FDG PET and susceptibility-weighted imaging (SWI) to assess cerebral glucose metabolism and iron deposition patterns in Parkinson's disease (PD), and to determine their correlations with clinical progression and diagnostic accuracy. Forty-nine PD patients and 70 age-/sex-matched healthy controls underwent standardized 18F-FDG PET and SWI. Metabolic activity (SUVR) and SWI phase values were quantified in cortical/subcortical regions. Statistical analyses included Mann-Whitney U tests, Pearson/Spearman correlations, and ROC curve analysis to evaluate biomarker-clinical relationships and diagnostic performance. PD patients exhibited hypometabolism in frontal, parietal, and temporal cortices (P < 0.05) and hypermetabolism in the putamen, globus pallidus, and cerebellum (P < 0.05). Cortical hypometabolism correlated with Hoehn-Yahr (H-Y) stages (e.g., temporal lobe: r = - 0.405, P = 0.004) and UPDRS III scores (e.g., frontal cortex: r = - 0.364, P = 0.011). SWI revealed reduced phase values in the substantia nigra, red nucleus, and basal ganglia (P < 0.001), with substantia nigra phase values strongly correlating with H-Y stages (r = - 0.525) and UPDRS III scores (r = - 0.446). Multimodal integration of 18F-FDG PET and SWI achieved superior diagnostic accuracy (AUC = 0.844) compared to single-modality models (PET: AUC = 0.777; SWI: AUC = 0.780, P < 0.0001). The integration of 18F-FDG PET and SWI enhances PD diagnosis by capturing complementary metabolic and iron deposition biomarkers. Cortical hypometabolism may precede subcortical iron accumulation, aligning with Braak staging theory. Limitations include cross-sectional design and technical constraints in SWI quantification. Future studies should validate these findings with longitudinal cohorts and advanced techniques like QSM.
Keywords: 18F-FDG PET; Diagnostic accuracy; Iron deposition; Multimodal biomarkers; Parkinson’s disease; Susceptibility-weighted imaging.
© 2025. The Author(s).
Conflict of interest statement
Declarations. Competing interests: The authors declare no competing interests.
Figures


References
-
- Li, L. et al. A Mendelian randomization study on association of alpha-synuclein and GPNMB with Parkinson’s disease risk and progression. Mol. Neurobiol.10.1007/s12035-025-04928-z (2025). - PubMed
-
- Jankovic, J. & Tan, E. K. Parkinson’s disease: Etiopathogenesis and treatment. J. Neurol. Neurosurg. Psychiatry91, 795–808. 10.1136/jnnp-2019-322338 (2020). - PubMed
MeSH terms
Substances
Grants and funding
- 2024fzyx020/Hubei Province Key Laboratory of Molecular Imaging
- 2024fzyx020/Hubei Province Key Laboratory of Molecular Imaging
- 2024fzyx020/Hubei Province Key Laboratory of Molecular Imaging
- 2024fzyx020/Hubei Province Key Laboratory of Molecular Imaging
- XYY2025QN09/Institution-Level Science and Technology Innovation Project
LinkOut - more resources
Full Text Sources
Medical
