. 2025 Jun 6;16(1):440.
doi: 10.1038/s41419-025-07748-0.

Gasdermin E deficiency limits inflammation and lung damage during influenza virus infection

Affiliations

Gasdermin E deficiency limits inflammation and lung damage during influenza virus infection

Sarah Rosli et al. Cell Death Dis. .

Abstract

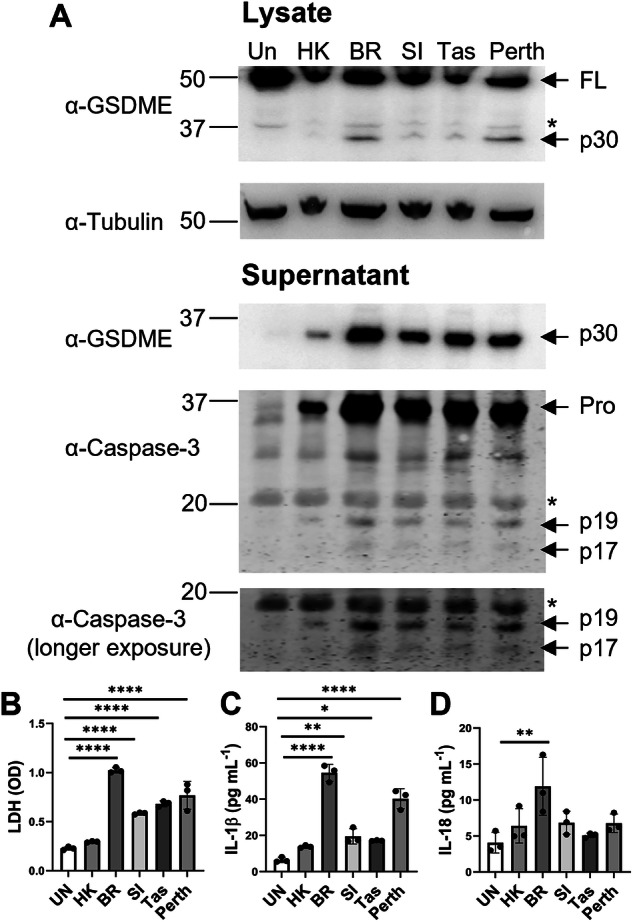
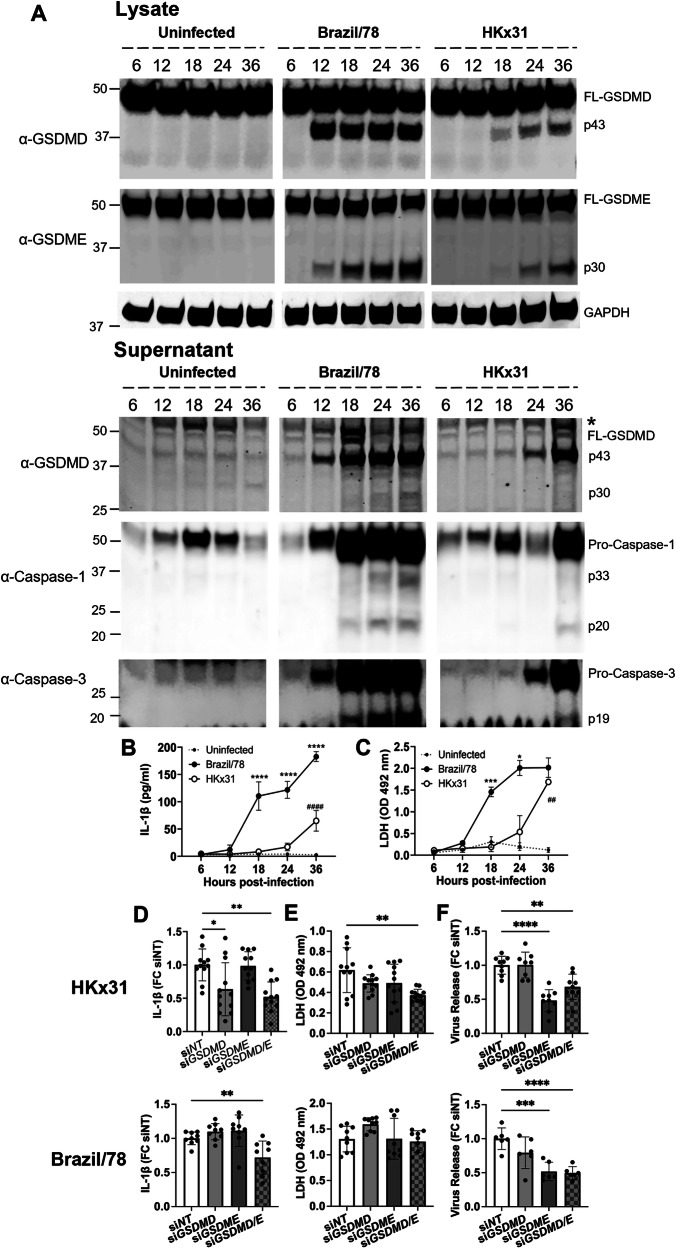
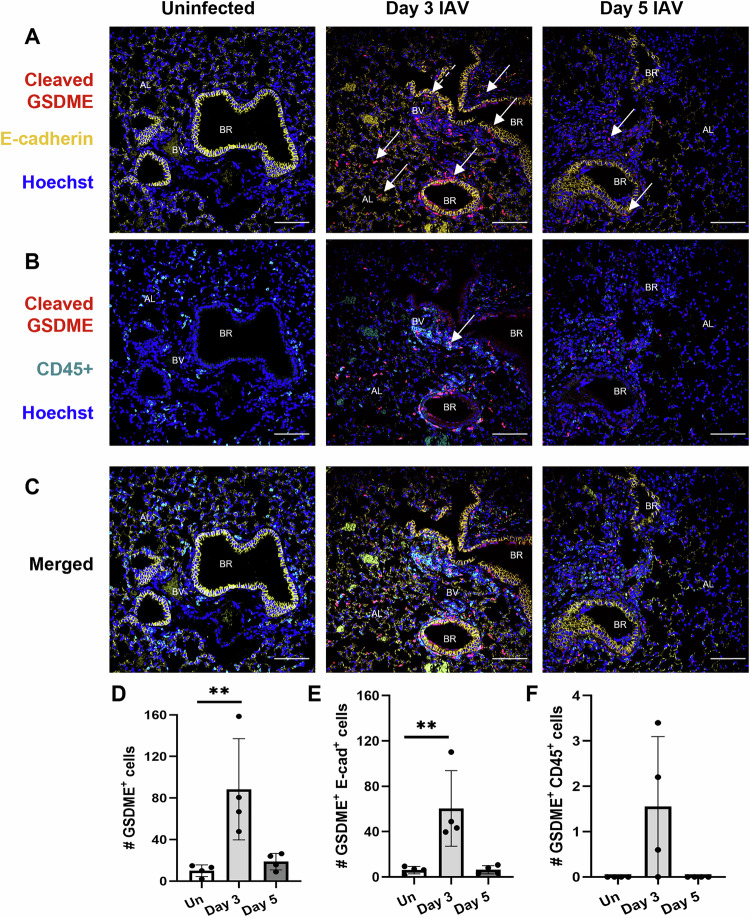
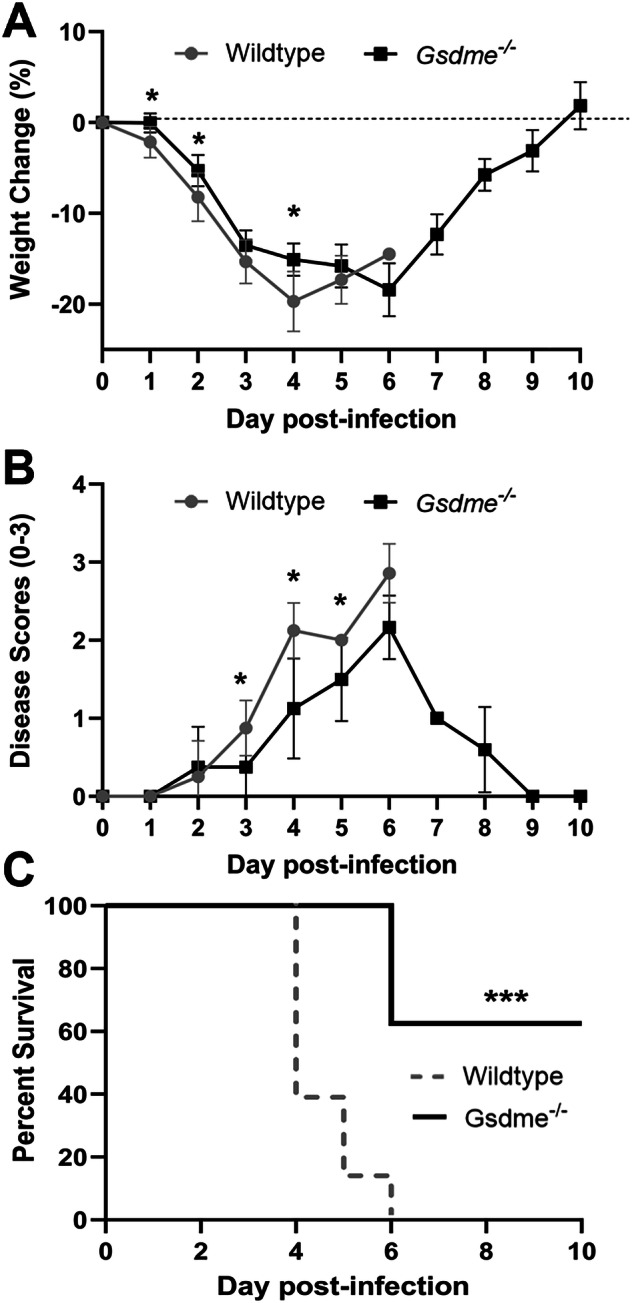
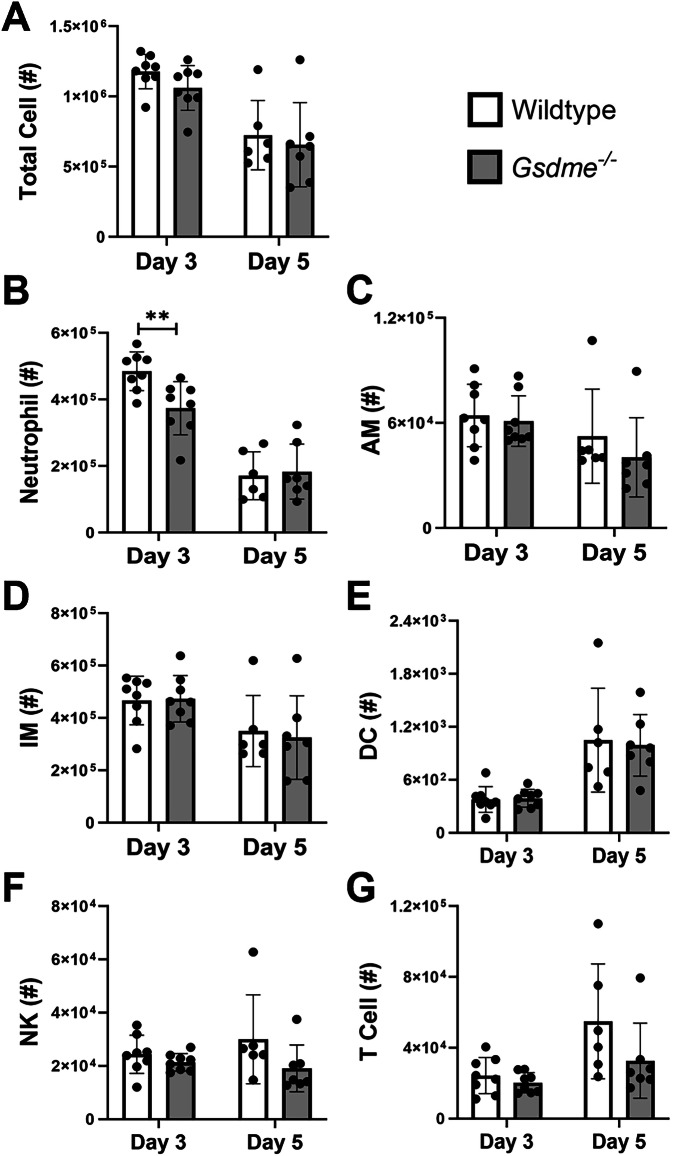
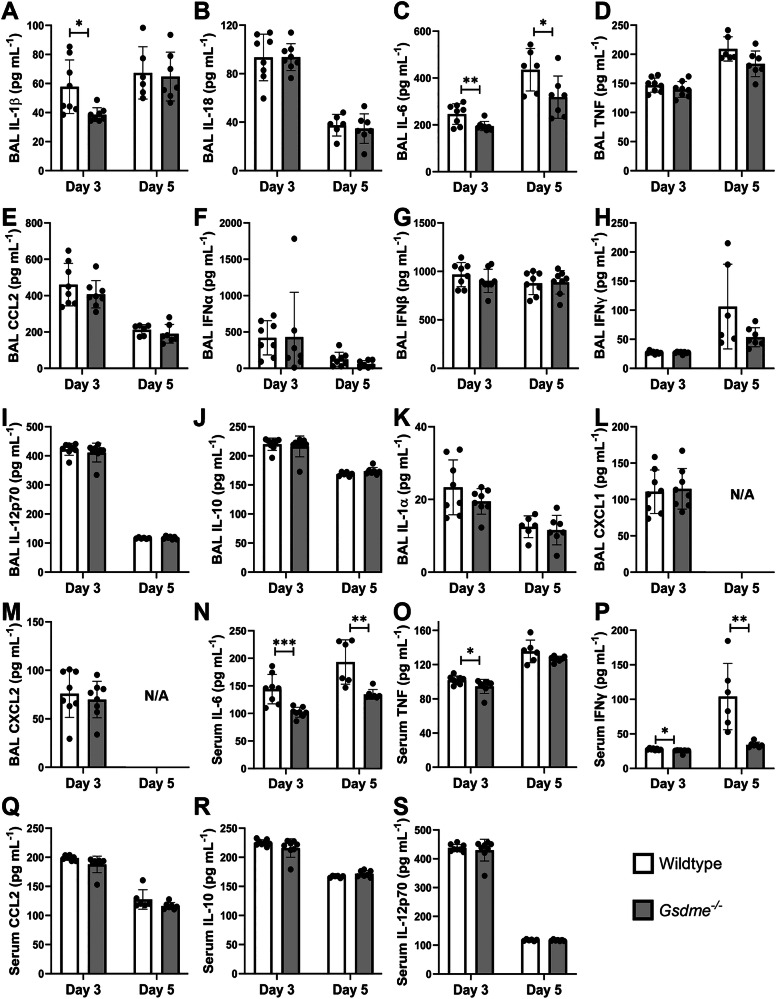
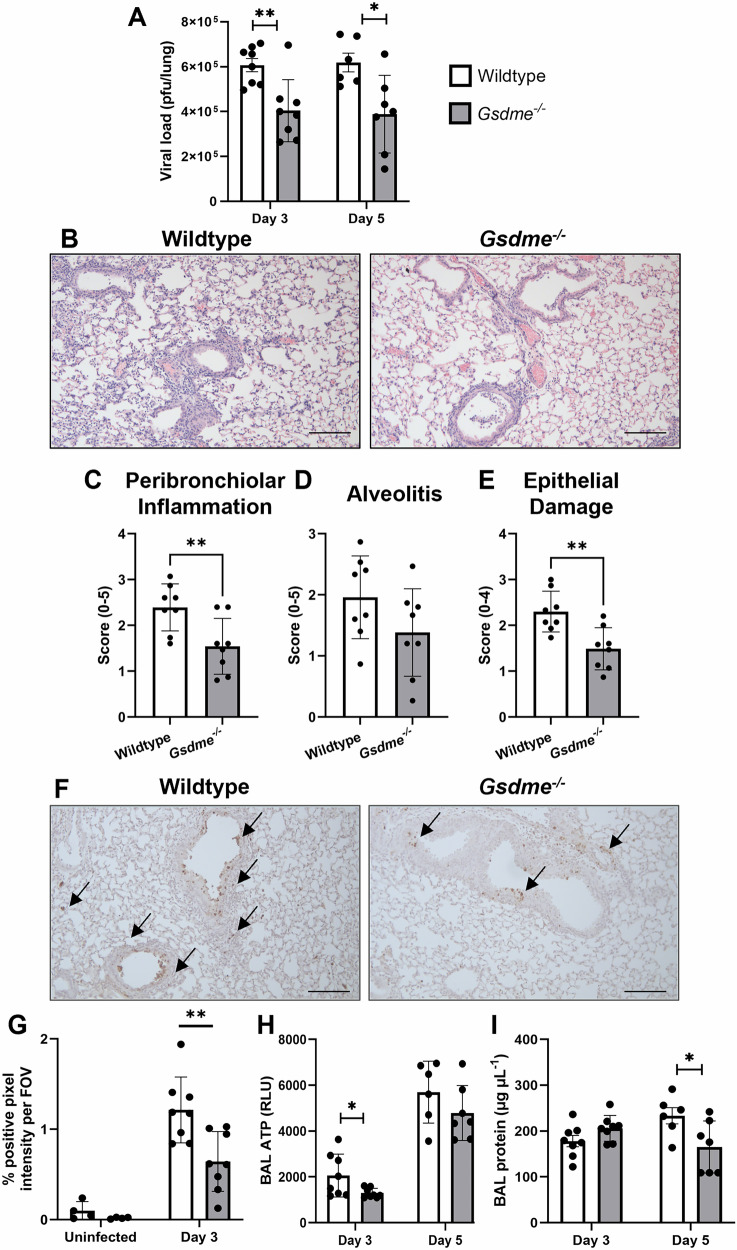
Severe influenza A virus (IAV) infections are associated with hyperinflammation and significant lung damage. Gasdermin E (GSDME) mediates pyroptosis, a lytic and inflammatory type of cell death. Cleavage of GSDME by caspase-3 releases the active N-terminal domain, which subsequently forms transmembrane pores, leading to cell lysis and death. In this study, we investigated a role for GSDME in severe influenza. Infection of human bronchial epithelial cells revealed that IAV induces GSDME cleavage and activation, with the magnitude and kinetics of GSDME activation differing between IAV strains. Caspase-3-mediated GSDME activation preceded and overwhelmed gasdermin D (GSDMD) activation. siRNA silencing in vitro confirmed both gasdermins are active in human bronchial epithelial cells and cooperate to drive IAV responses. IAV infection of mice promoted GSDME cleavage in E-cadherin+ epithelial cells in vivo at day 3. Mice deficient in GSDME (Gsdme-/-) showed improved survival and greater influenza disease resistance compared to their wildtype littermate controls. Gsdme-/- mice exhibited reduced neutrophil infiltration and levels of cytokines IL-6 and IL-1β in the airways and IL-6, TNF, and IFNγ in the serum. This was accompanied by reduced viral loads, lung pathology, and epithelial cell death. Together, these findings demonstrate a pivotal role for GSDME in severe influenza pathogenesis.


Conflict of interest statement

Competing interests: The authors declare no competing interests.

Figures

Fig. 1
Fig. 1. IAV infection promotes GSDME cleavage in human bronchial epithelial cells.
Human normal bronchial epithelial HBEC3-KT cells were infected with human IAV HKx31 (HK; H3N2), Brazil/78 (BR; H1N1), Solomon Islands/06 (SI; H1N1), Tasmania/09 (Tas; pandemic H1N1), or Perth/09 (Perth; H3N2) at a multiplicity of infection of 3 for 24 h. Uninfected (UN) cells were included for comparison. A Immunoblot of GSDME, caspase-3, and tubulin protein in cell lysates (top) and cell supernatants (bottom). Arrows indicate full length (FL) and cleaved N-terminal p30 subunit of GSDME, as well as caspase-3 precursor (pro) and cleaved p17 and p19 subunits. * Indicates a non-specific band. Data are representative of three independent experiments. Levels of B LDH (OD; optical density), C IL-1β, and D IL-18 in cell supernatants, determined by colorimetric assay or ELISA. BD Data are shown as experimental replicates that are representative of three independent experiments. Data are expressed as mean ± SD. *P < 0.05, **P < 0.01, ****P < 0.0001, one-way ANOVA.
Fig. 2
Fig. 2. GSDME and GSDMD are active in human bronchial epithelial cells following IAV infection.
AC Human normal bronchial epithelial HBEC3-KT cells were infected with human IAVs HKx31 (H3N2) or Brazil/78 (H1N1) at a multiplicity of infection of 3. Uninfected cells were included for comparison. A Immunoblot of GSDMD, GSDME, caspase-1, caspase-3, and GAPDH protein in cell lysates (top) or supernatants (bottom) at 6-36 h post-infection. Full-length (FL) and cleaved subunits of GSDME (active p30) and GSDMD (inactive p43 and active p30), as well as precursor (pro) and cleaved subunits of caspase-1 (p33, p20) and caspase-3 (p19), are shown. * Indicates a non-specific band. Data are representative of three independent experiments. Levels of B IL-1β and C LDH (OD; optical density) in cell supernatants, determined by ELISA or colorimetric assay, respectively. B, C Data presented as mean ± SD. *P < 0.05, **P < 0.01, ***P < 0.001, ****P < 0.0001, Brazil/78 vs HKx31, two-way ANOVA. ##P < 0.01, ####P < 0.0001, uninfected vs HKx31, two-way ANOVA. Data are representative of three independent experiments pooled. DF siRNA (si) silencing of GSDMD (siGSDMD), GSDME (siGSDME), or GSDMD/E (siGSDMD/E) expression in HBEC3-KT cells. Non-targeting (NT) siRNA control was included. At 48 h post-transfection, cells were infected with HKx31 or Brazil/78 at a multiplicity of infection of 3. D IL-1β levels and E LDH release (OD) in cell supernatants at 24 h post-infection, determined by ELISA or colorimetric assay, respectively. Data pooled from three or four independent experiments. For normalization between experiments, IL-1β data is presented as a fold change to NT control ± SD. *P < 0.05, **P < 0.01, one-way ANOVA. F Infectious virus in cell supernatants at 24 h post-infection, determined by plaque assay. Data pooled from two or three independent experiments and presented as fold change to NT control ± SD to normalize experimental variation. **P < 0.01, ***P < 0.001, ****P < 0.0001, one-way ANOVA.
Fig. 3
Fig. 3. IAV infection promotes cleavage of GSDME in vivo in murine lung epithelial cells.
Wildtype mice were infected with 104 PFU of HKx31 IAV, and lung tissues were formalin inflated and fixed on days 3 and 5 post-infection. Uninfected (Un) controls were included for comparison. n = 4 per group. AC Expression of cleaved GSDME (red) in lung tissue sections measured by confocal microscopy. Hoechst nuclear stain is shown in blue. Co-staining for E-cadherin (yellow; epithelial cells) and CD45 (cyan; leukocytes) was also performed. Representative images at 40x magnification (scale bar 100 µm) showing colocalization of A cleaved GSDME with E-cadherin and B cleaved GSDME with CD45. (C) Merged images showing cleaved GSDME, E-cadherin, CD45, and Hoechst. AC Bronchiole (BR), alveolus (AL), and blood vessels (BV) are labeled. Solid arrows indicate examples of colocalization. Dashed arrows indicate cleaved GSDME in cells around blood vessels. Number (#) of D cleaved GSDME+, E E-cadherin (E-cad)+ and cleaved GSDME+, and F CD45+ and cleaved GSDME+ cells per field of view (FOV). DF Five random FOVs were analyzed per animal using HALO software. Data are presented as mean cell count ± SD, with each data point representing an individual animal. P** < 0.01, one-way ANOVA.
Fig. 4
Fig. 4. GSDME deficiency limits the severity of IAV infection.
Gsdme−/− mice and wildtype littermate controls were infected with 104 PFU of HKx31 (H3N2) as a model of severe IAV infection. n = 8 per group. A Mouse weights were recorded daily and presented as mean percent weight change ± SD. *P < 0.05, two-tailed, unpaired Student’s t test. B Clinical signs of disease on a scale of 0–3 were scored daily, as described in the methods. *P < 0.05, two-tailed, unpaired Student’s t test. Results are expressed as mean ± SD. C Survival curves as shown. ***P < 0.001, Mantel–Cox log-rank test.
Fig. 5
Fig. 5. GSDME deficiency limits neutrophil infiltration in the airways.
Wildtype and Gsdme−/− mice were infected with 104 PFU HKx31 IAV, and BAL was performed on days 3 and 5 post-infection. Numbers (#) of A total live cells, B neutrophils, C alveolar macrophages (AMs), D Ly6C+ inflammatory monocytes/macrophages (IMs), E dendritic cells (DC), F natural killer (NK) cells, and G T cells in the BAL, determined by flow cytometry. AG n = 6, 7, or 8 per group. Data are presented as mean ± SD, with each data point representing an individual animal. **P < 0.01, two-tailed, unpaired Student’s t test.
Fig. 6
Fig. 6. GSDME deficiency limits the production of local and systemic pro-inflammatory cytokines.
Gsdme−/− mice and wildtype littermates were infected with 104 PFU HKx31 IAV. BAL (A-M) and serum (N-S) were collected on days 3 and 5 post-infection. Levels of A IL-1β, B IL-18, C IL-6, D TNF, E CCL2, F IFNɑ, G IFNβ, H IFNγ, I IL-12p70, J IL-10, K IL-1ɑ, L CXCL1, and M CXCL2 in BAL fluid. N/A indicates not assayed. Levels of N IL-6, O TNF, P IFNγ, (Q) CCL2, (R) IL-10, and (S) IL-12p70 in serum. AS Data determined by cytokine bead array, or ELISA. n = 6, 7, or 8 per group. Data are presented as mean ± SD, with each data point representing an individual animal. *P < 0.05, **P < 0.01, ***P < 0.001, two-tailed, unpaired Student’s t test.
Fig. 7
Fig. 7. GSDME deficiency limits viral burden, lung damage, and cell death.
Gsdme−/− mice and wildtype littermates were infected with 104 PFU HKx31 IAV. A Viral loads in lung tissues were measured by standard plaque assay at days 3 and 5 post-infection. Data are presented as plaque-forming units (pfu) per lung ± SD. *P < 0.05, **P < 0.01, two-tailed, unpaired Student’s t test. B Representative images of H&E-stained lung tissue sections on day 3, imaged at 10x magnification. Scale bar 100 µm. Lung sections were randomized and scored blindly as described in the methods for C peribronchial inflammation, D alveolitis, and E epithelial damage. (C-E) Data are presented as mean ± SD, with each data point representing an individual animal. **P < 0.01, two-tailed, unpaired Student’s t test. F Representative images of TUNEL assay labeling of cell death in lung tissue sections at day 3 post-infection. G Quantification of TUNEL staining determined with ImageJ software. Uninfected controls were included for comparison. Five random fields of view (FOV) were analyzed per animal. Data are presented as the mean percentage positive pixel intensity per field of view (FOV). H Levels of ATP in BAL fluid at day 3 determined by luminescent assay (relative luminescence; RLU). I BAL total protein concentration determined by colorimetric assay at day 3. GI n = 4, 6, 7, or 8 per group. Data are presented as mean ± SD, with each data point representing an individual animal. *P < 0.05, **P < 0.01, two-tailed, unpaired Student’s t test.

Similar articles

Cited by

References

    1. Shao W, Li X, Goraya MU, Wang S, Chen JL. Evolution of influenza a virus by mutation and re-assortment. Int J Mol Sci. 2017;18:1650. - PMC - PubMed
    1. Van Kerkhove MD, Vandemaele KA, Shinde V, Jaramillo-Gutierrez G, Koukounari A, Donnelly CA, et al. Risk factors for severe outcomes following 2009 influenza A (H1N1) infection: a global pooled analysis. PLoS Med. 2011;8:e1001053. - PMC - PubMed
    1. Nguyen THO, Rowntree LC, Chua BY, Thwaites RS, Kedzierska K. Defining the balance between optimal immunity and immunopathology in influenza virus infection. Nat Rev Immunol. 2024;24:720–35. - PubMed
    1. Zhao Y, Gao Y, Guyatt G, Uyeki TM, Liu P, Liu M, et al. Antivirals for post-exposure prophylaxis of influenza: a systematic review and network meta-analysis. Lancet. 2024;404:764–72. - PMC - PubMed
    1. Han J, Perez J, Schafer A, Cheng H, Peet N, Rong L, et al. Influenza virus: small molecule therapeutics and mechanisms of antiviral resistance. Curr Med Chem. 2018;25:5115–27. - PMC - PubMed

MeSH terms