. 2025 Jun 6;15(1):19883.
doi: 10.1038/s41598-025-04736-4.

Immune age is correlated with decreased TCR clonal diversity and antibody response to SARS-CoV-2

Affiliations

Immune age is correlated with decreased TCR clonal diversity and antibody response to SARS-CoV-2

Merlin Davies et al. Sci Rep. .

Abstract

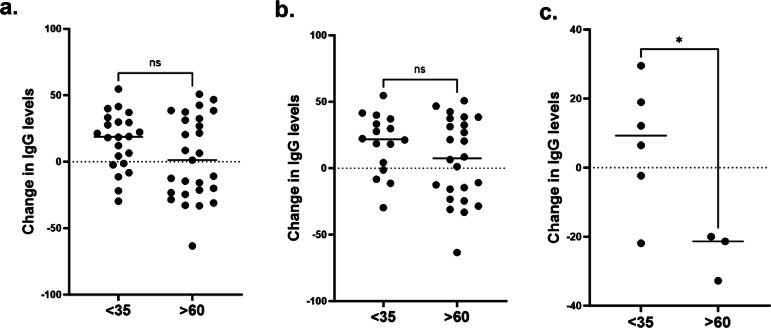
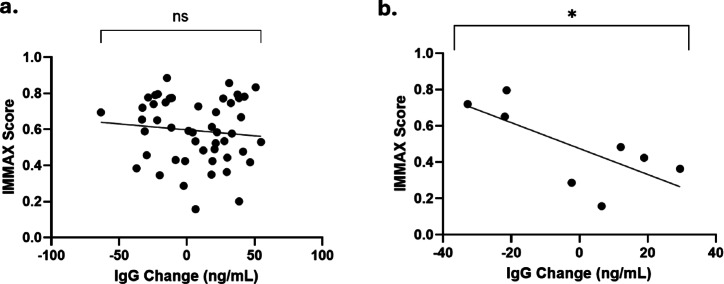
Immune response to infection or vaccination is compromised with age. We aimed to examine associations between immune senescence, T and B cell clonal diversity and immunoglobulin G secretion in response to immune challenge in isolated peripheral blood mononuclear cells (PBMC) from people of different chronological ages. We isolated PBMC from 49 individuals categorised into < 35 years and > 60 years age groups. Cells were then challenged with recombinant SARS-CoV-2 spike protein or vehicle and IMMAX score was calculated for each sample from flow cytometry. Antibody response was assessed using the proxy of IgG secretion and T cell receptor and immunoglobulin framework region recombination was determined by clonality studies. We observed that individuals aged > 60 years demonstrated a higher immune 'age' as calculated by IMMAX score (0.75 compared with 0.48 for individuals aged < 35 years; p = < 0.0001). Immune age negatively correlated with IgG responsivity in older individuals with recent prior exposure to SARS-CoV-2 (b = -0.01; p = 0.05). Higher immune age was also negatively correlated with TCR Vd + Jd receptor diversity regardless of immune challenge (b = -0.02; p = < 0.0001 and b = -0.02; r2 = 0.0.35; p = < 0.0001 for control and exposed samples respectively). Our data demonstrate that PBMC samples from older people display a higher cellular immune age and attenuation of immune response. This suggests that future treatments targeting cellular ageing of immune cells may be a useful avenue for investigation to improve immune function in older people.

Keywords: Immune age; Immune function; SARS-CoV-2; Senescence; T cell.


Conflict of interest statement

Declarations. Competing interests: LWH is Founder, Director and Chief Scientific Officer for SENISCA Ltd. Merlin Davies now works for SENISCA, but did not do so at the time this work was undertaken. HD is project lead for data science at SENISCA Ltd. The work described in this publication has no relationship with or bearing on SENISCA’s activities. All the remaining authors declare no conflict of interest.

Figures

Fig. 1
Fig. 1
The relationship between age and T cell subtypes. (A) Mean CD4 + and CD8 + T cell frequencies compared between young and older participants. (B) CD4 + T cell subset comparisons between young and older study participants. (C) CD8 + T cell subset comparisons between young and older study participants. EM = effector memory. CM = central memory. EMRA = terminally differentiated effector memory cells re-expressing CD45RA. * = p < 0.05, ** = p < 0.01, *** = p < 0.001, ****= p < 0.0001.
Fig. 2
Fig. 2
People aged > 65 years (n = 27) demonstrate increased IMMAX age. People aged < 35 years (n = 22) and > 65 years (n = 27) demonstrate increased IMMAX age. IMMAX age is given on the Y axis and chronological age on the X axis. Statistical significance was determined using a T test (p < 0.0001). The horizontal lines represent the median of the measurement. Error bars represent 95% CI (confidence interval). * = p < 0.05, ** = p < 0.01, *** = p < 0.001, ****= p < 0.0001.
Fig. 3
Fig. 3
IgG production response to Spike protein in peripheral blood mononuclear cells from older and younger individuals. a) Change in IgG secretion in the entire study population, split by donor age. b) Change in IgG secretion in participants with no known diagnosis of SARS-CoV-2 or vaccination within 6 months of blood sampling c) Change in IgG secretion in participants with known SARS-CoV-2 infection or vaccination within 6 months of blood sampling. Change in IgG levels in response to provocation with SARS-CoV-2 spike protein are given in ng/mL of IgG for 3 technical replicates. Statistical Significance was assessed by repeated measures ANOVA. * = p < 0.05, ** = p < 0.01, *** = p < 0.001, ****= p < 0.0001.
Fig. 4
Fig. 4
Linear regressions between IMMAX scoring and IgG production in response to spike protein. Change in IgG levels in response to provocation with SARS-CoV-2 spike protein are given in ng/mL of IgG for 3 technical replicates. Analysis was linear regressions performed between paired IMMAX scoring (y axis) and IgG production (x-axis). Circles indicate individual participant. (A) All Study population PBMC samples (n = 49). (B) A subset of samples from the total sample population who self-reported as diagnosed with SARS-CoV-2 infections within the 6 months leading up to the date of their blood sampling and did not have any self-reported health conditions (n = 8). * = p < 0.05, ** = p < 0.01, *** = p < 0.001, ****= p < 0.0001.
Fig. 5
Fig. 5
BCR and TCR gene rearrangement clonality in younger/older PBMCs. A single peak refers to a single clone within the assay, with median and 95% confidence intervals plotted. Black data points indicate individual participant median peak number for each assay. Each graph represents a different region for either BCR or TCR genes. BCR genes indicate heavy chain FR regions. TCR genes cover VDJ recombination assays. A) TCRβ Vβ + Jβ2 (1) assay. B) TCRβ Vβ + Jβ1 assay. C) TCRβ Vβ + Jβ2 (2) assay. D) TCRβ Dβ + Jβ2 (1) assay. E) TCRβ Dβ + Jβ1 assay. F) TCRδ Vδ + Jδ assay. G) TCRδ Vδ + Dδ3 assay. H) BCR FR2 assay. I) BCR FR3 assay. Statistical analysis performed were T test between groups. * = p < 0.05, ** = p < 0.01, *** = p < 0.001, ****= p < 0.0001.
Fig. 6
Fig. 6
Linear regressions between IMMAX scoring and TCR delta gene clonality peak numbers. Data points indicate individual participant median peak number calculated from technical triplicates for the TCRδ Vδ + Jδ assay. Peak number for the assay is given on the x-axis and IMMAX scores given on the y-axis. Linear regressions were run for (A) PBMC control samples from each study participant (p = 0.0001, n = 49) and (B) PBMC samples from each participant treated with spike protein (p < 0.0001, n = 49). * = p < 0.05, ** = p < 0.01, *** = p < 0.001, ****= p < 0.0001.

Similar articles

References

    1. Hagg, S. & Religa, D. COVID vaccination in older adults. Nat. Microbiol.7, 1106–1107. 10.1038/s41564-022-01166-0 (2022). - PubMed
    1. Palacios-Pedrero, M. A. et al. Signs of Immunosenescence correlate with poor outcome of mRNA COVID-19 vaccination in older adults. Nat. Aging. 2, 896–905. 10.1038/s43587-022-00292-y (2022). - PMC - PubMed
    1. Soegiarto, G. & Purnomosari, D. Challenges in the vaccination of the elderly and strategies for improvement. Pathophysiology30, 155–173. 10.3390/pathophysiology30020014 (2023). - PMC - PubMed
    1. Aiello, A. et al. Immunosenescence and its hallmarks: how to oppose aging strategically?? A review of potential options for therapeutic intervention. Front. Immunol.10, 2247. 10.3389/fimmu.2019.02247 (2019). - PMC - PubMed
    1. Di Micco, R., Krizhanovsky, V. & Baker, D. D’Adda Di fagagna, F. Cellular senescence in ageing: from mechanisms to therapeutic opportunities. Nat. Rev. Mol. Cell. Biol.22, 75–95. 10.1038/s41580-020-00314-w (2021). - PMC - PubMed

MeSH terms