. 2025 Jun 6;15(1):19970.
doi: 10.1038/s41598-025-04666-1.

Dysregulation of cell migration by matrix metalloproteinases in geleophysic dysplasia

Affiliations

Dysregulation of cell migration by matrix metalloproteinases in geleophysic dysplasia

Alejo A Morales et al. Sci Rep. .

Abstract

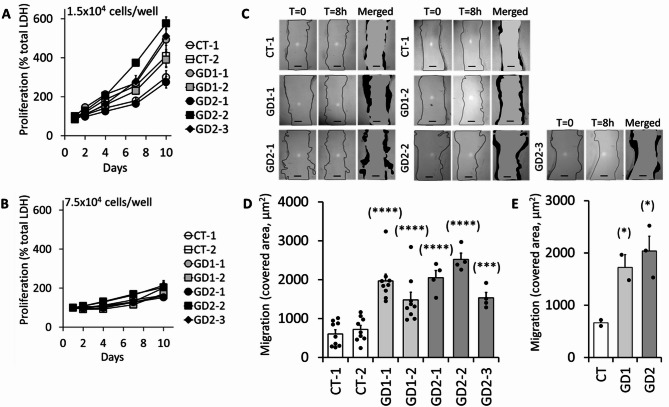
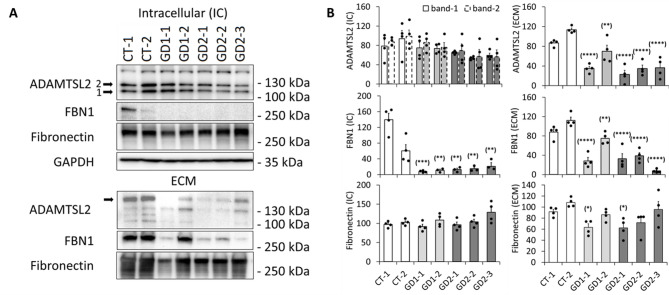
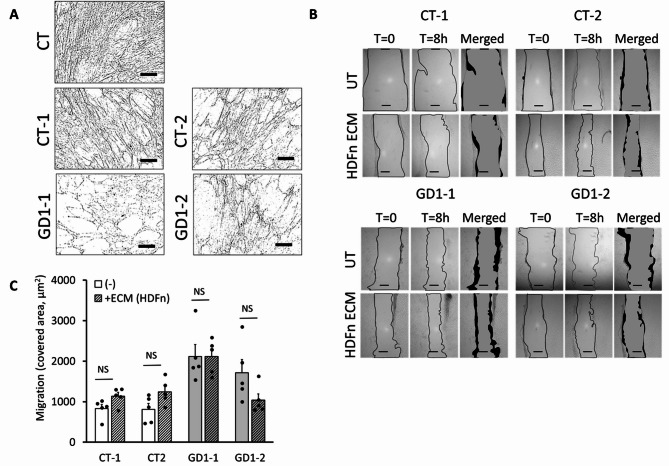
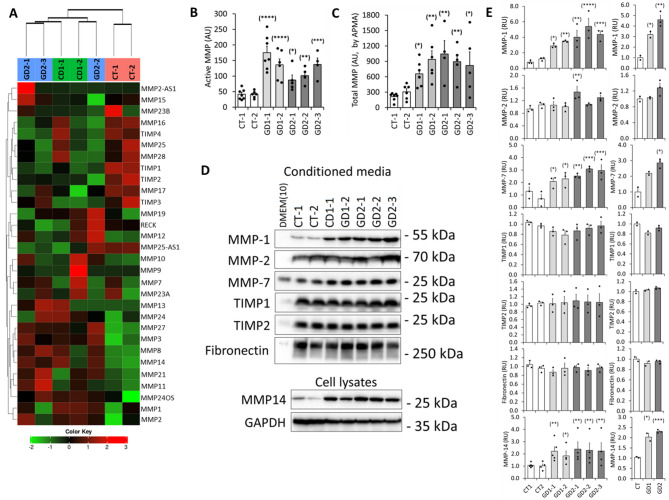
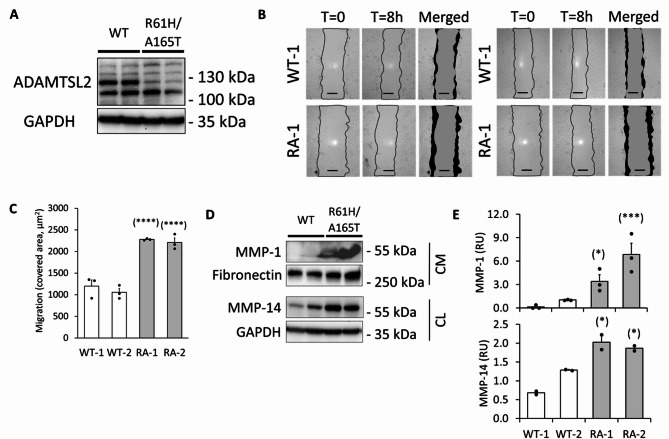
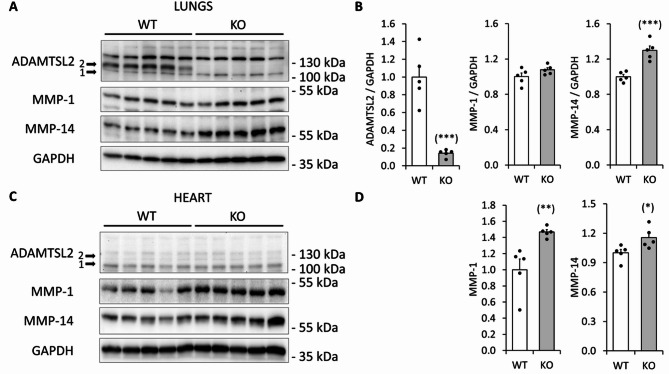
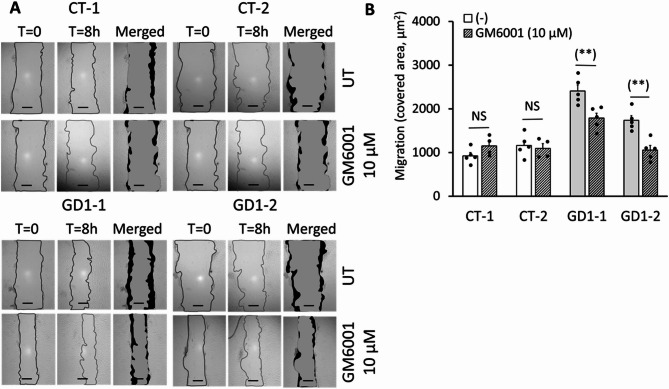
Geleophysic dysplasia (GD) is characterized by short stature, brachydactyly, joint limitations, a distinctive facial appearance, as well as cardiac and respiratory dysfunction that can be life-threatening. GD is caused by pathogenic variants in the ADAMTSL2, FBN1, or LTBP3 genes. While dermal fibroblasts derived from affected individuals have shown poor organization of the extracellular matrix (ECM), it remains elusive how the disorganized ECM contributes to GD pathogenesis. To understand the molecular mechanisms in GD, we isolated and characterized primary human dermal fibroblasts from affected individuals with ADAMTSL2 and FBN1 variants. We found that the secretion of ECM proteins including ADAMTSL2, FBN1, and Fibronectin were impaired in GD fibroblasts. Increased cell migration was observed in GD fibroblasts carrying ADAMTSL2 or FBN1 variants, which was associated with up-regulation of MMP-1 and MMP-14, two proteases related to cell mobility. The enhanced cell migration and up-regulation of MMP-1 and MMP-14 were corroborated in mouse primary dermal fibroblasts carrying pathogenic variants in Adamtsl2 and in lung and heart tissues from Adamtsl2-knockout mice. A pan MMP inhibitor, GM6001, inhibited the migration of GD fibroblasts. Overall, our results suggest that MMP-1/-14 up-regulation play a role in the development of GD and may be utilized as a treatment target.

Keywords: ADAMTSL2; FBN1; Geleophysic dysplasia; MMP-1; MMP-14; MMPs.


Conflict of interest statement

Declarations. Competing interests: The authors declare no competing interests.

Figures

Fig. 1
Fig. 1
Patient fibroblasts migrate faster than control fibroblasts without significant difference in cell proliferation. (A) Two control cell lines (CT), two GD1 cell lines with ADAMTSL2 mutations and three GD2 cell lines with FBN1 mutations were used. Cell proliferation was assessed using the LDH assay, as the percentage (%) of total LDH per well compared to the day-1 as 100%, and two different initial densities: 1.5 × 104 cells/well and (B) 7.5 × 104 cells/well. Averages and standard error (SE) were calculated for 3 independent experiments. No significant difference was found between the cells when they were compared to the CT fibroblasts. (C) Cell migration was assessed using the wound healing scratch assay for 8 h. Scale bar = 50 μm. Nine independent experiments were conducted, each with eight replicates per cell line; except for the GD2 cell lines, which were analyzed in five experiments. For each experiment, the average of the eight replicates per cell line was calculated and used for analysis. Representative images after the scratch (T = 0) were selected and the covered area was determined using ImageJ software (black area) as illustrated in Figure S1. (D) The covered area was calculated in µm2 using ImageJ software. Patient fibroblasts migrated faster than control cells. (E) Average for CT (2 primary cells), GD1 (2 primary cells) and GD2 (3 primary cells) were calculated and compared. Significance was calculated using a 1-way Anova test and values were compared versus all values of CT fibroblasts (*p < 0.05 and ****p < 0.0001). Bars and error bars represent the average and SE for all values, respectively.
Fig. 2
Fig. 2
Patient fibroblasts show impaired ECM protein accumulation. Two control cell lines (CT), two GD1 cell lines with ADAMTSL2 mutations and three GD2 cell lines with FBN1 mutations were used. Intracellular lysates (IC) and extracellular matrix lysates (ECM) were analyzed by WB, using GAPDH and fibronectin as IC and ECM controls, respectively. ADAMTSL2 was detected mainly in the IC compartment (band-1 and band-2, as in Figure S2) while FBN1 and fibronectin proteins were detected mainly in the ECM space. (A) ADAMTSL2, FBN1 and fibronectin deposition in the ECM were impaired in patient’s fibroblasts. Intracellular FBN1 was decreased also in patient’s cells. Representative images were selected from four independent experiments. Original uncropped blots are shown in Figure S3. (B) Densitometry analysis was completed using ImageJ software. Significance was calculated using a 1-way Anova test and values were compared versus all values of CT fibroblasts (*p < 0.05, **p < 0.01, and ***p < 0.001, and ****p < 0.0001). Bars and error bars represent the average and SE for all values, respectively for four independent experiments.
Fig. 3
Fig. 3
ECM from control fibroblasts does not inhibit migration of patient fibroblasts. (A) Three control cell lines (CT) and two GD1 cell lines with ADAMTSL2 mutations were used. ECM deposition for GD1 patient fibroblasts was impaired when compared with CT fibroblasts. Pictures of decellularized ECM were transformed into binary images (black and white) for visualization and quantification purposes using ImageJ. Representative images were selected from 5 independent experiments. Scale bar = 200 μm. (B) Cells were grown on top of the ECM from control fibroblast (HDFn) for 48 h (confluency). Cell migration was assessed using the wound healing scratch assay for 8 h. Scale bar = 50 μm. Representative images were selected from four independent experiments, using two CT fibroblasts and two GD1 patient’s fibroblasts. (C) Covered area (dark) in µm2 was calculated using ImageJ software. Significance was calculated using a 2-way Anova test. The p values are shown only for samples +/- ECM from HDFn control cells (NS, not significant). Bars and error bars represent the average and SE for all values, respectively.
Fig. 4
Fig. 4
Patient fibroblasts express high levels of MMPs. Two control cell lines (CT), two GD1 cell lines with ADAMTSL2 mutations and three GD2 cell lines with FBN1 mutations were used. (A) RNA-Seq transcriptome analysis of patient fibroblast from GD1 (N = 2) and GD2 (N = 3) compared to controls (N = 2). Semi-supervised hierarchical clustering of MMPs and TIMPs transcripts. (B) Cells were grown, and medium was not changed for 10 days. Instead, small aliquots of fresh medium were added every other day. Active MMPs were determined in the conditioned medium using a fluorometric assay (MMP Activity Assay Kit). Medium (DMEM + 10% FBS) was used as negative control. The fluorescence signal, as Relative Fluorescence Unit (RFU), was averaged for each sample from six independent experiments. All samples were compared to the CT average. (C) Conditioned media were treated with p-Amino phenyl mercuric acetate (APMA) for two hours at 37oC; and Total MMP activity was determined following a similar protocol. (D) MMP proteins were analyzed by WB using the CM (secreted MMPs) or cell lysates (MMP-14, a transmembrane protein). Medium [DMEM(10), DMEM + 10% FBS] was used as negative control. Fibronectin and GAPDH were used as loading controls for CM and cell lysates, respectively. Representative images were selected from three independent experiments for conditioned media and four independent experiments for cell lysates (MMP-14). Original uncropped blots are shown in Figure S4 (E) Densitometry analysis was performed using ImageJ software. Significance was calculated using a 1-way Anova test and values were compared versus all values of CT fibroblasts (*p < 0.05, **p < 0.01, and ***p < 0.001, and ****p < 0.0001). Bars and error bars represent the average and SE for all values, respectively.
Fig. 5
Fig. 5
Mouse dermal fibroblasts from GD1 mouse model show enhanced migration and up-regulation of MMP-1 and MMP-14. Two WT cell lines (WT), two GD1 cell lines with ADAMTSL2 mutations (p.R61H and p.A165T) were used. (A) WB showed multiple non-specific bands for fibroblasts lysates and a band (most probably attributed to the N-glycosylated form of ADAMTSL2) was strongly reduced in the R61H/A165 T lysates. Original uncropped blots are shown in Figure S6 (B) Cells were grown for 48 h (confluency). Cell migration was assessed using the wound healing scratch assay for 8 h. Scale bar = 50 μm. Representative images were selected from three independent experiments, using two WT fibroblasts and two R61H/A165T fibroblasts. (C) Covered area (dark, in Arbitrary Units) was calculated using ImageJ software. (D) MMP-1 protein was analyzed by WB using 10-days conditioned media and MMP-14 was analyzed using cell lysates. Fibronectin and GAPDH was used as loading controls for CM and cell lysates. Representative images were selected from three independent experiments for the conditioned media (MMP-1) and two independent experiments for cell lysates (MMP-14). (E) Densitometry analysis was performed using ImageJ software. Significance was calculated using a 1-way Anova test and values were compared versus all values of CT fibroblasts (*p < 0.05, ***p < 0.001 and ****p < 0.0001). Bars and error bars represent the average and SE for all values, respectively.
Fig. 6
Fig. 6
Lung and heart lysates from ADAMTSL2-KO neonate mice showed up-regulation of MMP-1 and MMP-14. Five WT neonate mice and five ADAMTSL2-KO mice were used to collect lungs and hearts (A) WB showed multiple non-specific bands for the WT lung lysates and a band (most probably attributed to the N-glycosylated form of ADAMTSL2) was not present in the ADAMTSL2-KO lysates. Lung lysates from ADAMTSL2-KO mice showed upregulation of MMP-14. Original uncropped blots are shown in Figure S7 (B) Densitometry analysis for ADAMTSL2, MMP-1 and MMP-14 was performed using ImageJ software. Significance was measured using a t-test and values were compared versus WT lysates (***p < 0.001). (C) WB showed multiple non-specific bands for the WT and ADAMTSL2-KO heart lysates with no significant difference. Heart lysates from ADAMTSL2-KO mice showed upregulation of MMP1 and MMP-14. (D) Densitometry analysis for MMP-1 and MMP-14 was performed using ImageJ software. Significance was calculated using a t-test and values were compared versus WT lysates (*p < 0.05, **p < 0.01 and ***p < 0.001). Bars and error bars represent the average and SE for all values, respectively.
Fig. 7
Fig. 7
MMPs broad-spectrum inhibitor GM6001, inhibits migration of patient fibroblasts. Two control cell lines (CT) and two GD1 cell lines with ADAMTSL2 mutations were used. (A) Cells were plated and after 24 h were treated with 10 µM GM6001. Treatment was extended for 24 h and during the migration assay. Cell migration was assessed using the wound healing scratch assay for 8 h. Scale bar = 50 μm. Representative images were selected from four independent experiments, using two CT fibroblasts and two GD1 patient fibroblasts. (B) Covered area (dark) in µm2 was calculated using ImageJ software. Significance was calculated using a 2-way Anova test. The p values are shown only for untreated vs. treated samples (**p < 0.01). Bars and error bars represent the average and SE for all values, respectively.

Similar articles

Cited by

References

    1. Marzin, P. & Cormier-Daire, V. Geleophysic Dysplasia. In GeneReviews® [Internet] (eds Adam, M. P. et al.) (University of Washington, Seattle) (1993–2024). - PubMed
    1. Marzin, P. et al. Geleophysic and acromicric dysplasias: natural history, genotype-phenotype correlations, and management guidelines from 38 cases. Genet. Medicine: Official J. Am. Coll. Med. Genet.23, 331–340 (2021). - PubMed
    1. Spranger, J. W., Gilbert, E. F., Tuffli, G. A., Rossiter, F. P. & Opitz, J. M. Geleophysic dwarfism–a focal. mucopolysaccharidosis? Lancet (London England). 2, 97–98 (1971). - PubMed
    1. Spranger, J., Gilbert, E. F., Arya, S., Hoganson, G. M. I. & Opitz, J. M. Geleophysic Dysplasia19, 487–499 (1984). - PubMed
    1. Lipson, A. H., Kan, A. E. & Kozlowski, K. Geleophysic dysplasia-acromicric dysplasia with evidence of glycoprotein storage. Am. J. Med. Genet. Suppl.3, 181–189 (1987). - PubMed

MeSH terms

Supplementary concepts

LinkOut - more resources