. 2025 Jun 6;15(1):19926.
doi: 10.1038/s41598-025-04996-0.

Deferential nephrotoxicity effect of lanthanum oxide nanoparticle responses to concentration and time in vivo

Affiliations

Deferential nephrotoxicity effect of lanthanum oxide nanoparticle responses to concentration and time in vivo

Nouf M Alyami et al. Sci Rep. .

Abstract

Lanthanum oxide nanoparticles (La₂O₃ NPs) possess unique electronic properties. The increased use of La₂O₃ NPs raises the risk of exposure, potentially leading to bioaccumulation and metabolic disruptions. This study examines the impact of La₂O₃ NPs on the kidneys of mice administered intraperitoneally (i.p) at doses of 60, 150, and 300 mg/kg for 14 and 35 days. Results indicated variations in SOD gene expression and GSH plasma levels that were inversely correlated with NP dosage. A strong positive relationship was found between the inflammatory marker NOS2 transcription and NP dose, confirming pro-inflammatory effects based on concentration. Significant elevations, particularly at lower NP doses, were observed with KIM-1, uric acid, urea, ALP, ALT, and AST, indicating kidney and liver dysfunction. Furthermore, markers of kidney inflammation, as determined by protein array, intensified with prolonged exposure to the lowest concentrations of La₂O₃ NPs. In contrast, higher doses initially caused inflammation that subsided over time. Along with the disruption of mineral balance detected by Inductively Coupled Plasma Mass spectrometry (ICP-MS) (specifically the loss of Ca2+), we believe these factors are the main contributors to nephrotoxicity, the adverse effects of La₂O₃ NPs releasing free La³⁺ ions, which mimic calcium-activating ROS production that worsens at lower concentrations due to their reduced aggregation and enhanced ability to penetrate the cell membrane. However, further studies must confirm whether these effects result from direct nanoparticle circulation in the bloodstream or secondary toxicity mechanisms.

Keywords: Cytokines; ICP-MS; Inflammation; Kidney injury; Lanthanum oxide; Nanoparticle; Protein array; ROS; Rare Earth elements; Toxicity.


Conflict of interest statement

Ethics declarations. Competing interests: The authors declare no competing interests. Ethics approval: The experimental protocol was approved by King Saud University’s Institutional Animal Care and Use Committee (IACUC) (Ref. No.: KSU-SE-22-75).

Figures
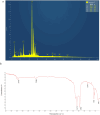
Fig. 1
Fig. 1
a) EDS spectra of La₂O₃ NPs samples indicate the presence (wt%) of elements such as lanthanum, oxygen, aluminum, chlorine, and platinum. b) FTIR spectra of La₂O₃ NPs: List of infrared spectroscopy absorptions by frequency regions.
Fig. 2
Fig. 2
SEM micrographs of the dispersed La₂O₃ NPs sample at magnifications (a) x20k, (b) x20k, (c) x30k, and (d) x45k. The nanoparticles mainly exhibit rod and spherical shapes, with a hydrodynamic size of 128.871 ± 45.60 nm (SD).
Fig. 3
Fig. 3
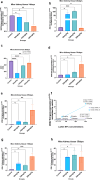
Dose- and time-dependent effects of lanthanum oxide nanoparticles on gene expression in kidneys. a, and b) Fold changes in SOD gene expression relative to untreated controls after 14 and 35 days. A significant downregulation was observed at medium and high doses on day 14, while low and medium doses showed significant upregulation on day 35. c) GSH enzyme levels significantly decreased across all doses after 35 days, correlating negatively with nanoparticle concentration. d, and e) NOS2 gene expression amplified in the high-dose group after 14 and 35 days, with significant elevations at lower doses on day 35. f) Pearson regression analysis showed a positive correlation between NOS2 transcription and nanoparticle concentrations at both time points. g and h) KIM-1 gene expression significantly increased at high doses on day 14 and across all doses on day 35. Data representing the mean ± SEM. *p < 0.05, ** p < 0.01, ***p < 0.001, and ****p < 0.0001 were considered significant using one-way ANOVA and the Dunnett post-hoc test; ns (not significant). RT-qPCR was performed in duplicate with biological triplicate.
Fig. 4
Fig. 4
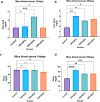
Kidney enzyme activity reflects tissue damage and inflammation. a and b) Uric acid levels were significantly elevated at medium doses on day 14 and low and high doses on day 35. c, and d) Urea accumulation showed no significant changes on day 14 but increased significantly across all doses by day 35. Data representing the mean ± SEM. *p < 0.05, ** p < 0.01, ***p < 0.001, and ****p < 0.0001 (in triplicate) were considered statistically significant using one-way ANOVA and the Dunnett post-hoc test; ns (not significant).
Fig. 5
Fig. 5
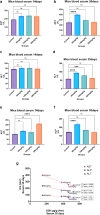
Liver enzyme levels indicate systemic inflammation. a, and b) AST levels increased significantly at low and medium doses after 35 days. c, and d) ALT levels showed significant elevations at low and medium doses on day 35, with no changes on day 14. e, and f) ALP levels increased at low and high doses on day 14, with sustained elevations at low doses on day 35. g) Pearson regression analysis revealed a strong negative correlation between GSH levels and liver enzyme activity. Data representing the mean ± SEM. *p < 0.05, **p < 0.001, and ***p < 0.0001 (in triplicate) were considered statistically significant using one-way ANOVA and the Dunnett post-hoc test, ns (not significant).
Fig. 6
Fig. 6
La2O3 nanoparticles activate the kidney’s cytokines response and describe Ca homeostasis. a) Mouse cytokine array images show fold changes relative to control, comparing treatment with 60 mg/kg nanoparticles for 14 and 35 days. BID, BAX, and IGF-2 proteins increased in 14-day samples, while CD40 ligand, IGF2BP-5, and CD40 were prominent at 35 days. FOS (Apo-1) expression peaked at 14 days but fell by 35 days. b) Cytokine array images of kidney lysates treated with 300 mg/kg nanoparticles for 14 and 35 days. Protein levels rose in 14 days, including BCL-W, TNFRII, and p53, then decreased by 35 days. Data show fold changes in inflammatory cytokine levels, with transient SMAC, cIAP-2, and HSP27 elevations on day 14. Sustained expression of IGF-2, IGF2BP-5, and TRAIL-R2 were noted at 35 days. c) Pearson analysis showed a significant and positive correlation between Ca, Na, Mg, and Cu mineral concentrations after 14 days, arranged as follows: 60 mg/L (the lowest), control (the highest), and 150 and 300 mg/kg in between. However, a negative correlation of -0.72 was observed with K. d) Pearson correlation and simple linear regression revealed a negative correlation between Ca and K ions (p = 0.29, r = -0.706) after 35 days of exposure. Over time, the Na, Mg, and Cu mineral concentrations continued to decrease, surpassing 300 mg/kg, resulting in a severe progression of induction, where 300 mg/kg exhibited an acute effect. One-way ANOVA, the Dennett post-hoc test, Pearson Correlation, and simple linear regression (n = 3) were used.
Fig. 7
Fig. 7
Photomicrographs of hematoxylin and eosin (H&E)-stained kidney sections after 14 and 35 days. (a) Represents the control group illustrating normal glomerulus (thin arrow). (b) Displays La₂O₃ NPs 60 mg/kg for 14 days, showing inflammatory cells around the glomerulus (thick arrow). (c) La₂O₃ NPs (150 mg/kg) administered for 14 days resulted in exposed mice exhibiting noticeable features, including hemorrhage (black arrowhead) and inflammatory cells (arrow). (d) La₂O₃ NPs (300 mg/kg) for 14 days, illustrating inflammatory cells (arrow) and Glomerular atrophy (red arrowhead). (e) Displays La₂O₃ 60 mg/kg for 35 days, showing inflammatory cells (arrow). (f) Mice exposed to La₂O₃ NPs (150 mg/kg) for 35 days showed noticeable features, including inflammatory cells (thick arrow). Glomerular atrophy (indicated by the red arrowhead) was also observed. (g) La₂O₃ NPs (300 mg/kg) administered for 35 days resulted in glomerular atrophy and degeneration of some renal tubules. Scale bar = 200 μm.

Similar articles

References

    1. Alyami, N. M., Almeer, R. & Alyami, H. M. Role of green synthesized platinum nanoparticles in cytotoxicity, oxidative stress, and apoptosis of human colon cancer cells (HCT-116). Heliyon8 (12), e11917 (2022). - PMC - PubMed
    1. Almasoud, H. A. et al. Dose-Dependent Variation in Anticancer Activity of Hexane and Chloroform Extracts of Field Horsetail Plant on Human Hepatocarcinoma Cells2022p. 5778411 (BioMed Research International, 2022). 1. - PMC - PubMed
    1. Martins, A. et al. Enhanced cytotoxicity against a pancreatic Cancer cell line combining radiation and gold nanoparticles. Pharmaceutics, 16(7). (2024). - PMC - PubMed
    1. Li, Y. et al. Assessment the exposure level of rare Earth elements in workers producing cerium, lanthanum oxide ultrafine and nanoparticles. Biol. Trace Elem. Res.175 (2), 298–305 (2017). - PubMed
    1. Yuan, L. et al. La(2)O(3) nanoparticles induce reproductive toxicity mediated by the Nrf-2/ARE signaling pathway in Kunming mice. Int. J. Nanomed.15, 3415–3431 (2020). - PMC - PubMed

MeSH terms

LinkOut - more resources