

Unlocking sea turtle diving behaviour from low-temporal resolution time-depth recorders
- PMID: 40481176
- PMCID: PMC12144214
- DOI: 10.1038/s41598-025-05336-y
Unlocking sea turtle diving behaviour from low-temporal resolution time-depth recorders
Abstract
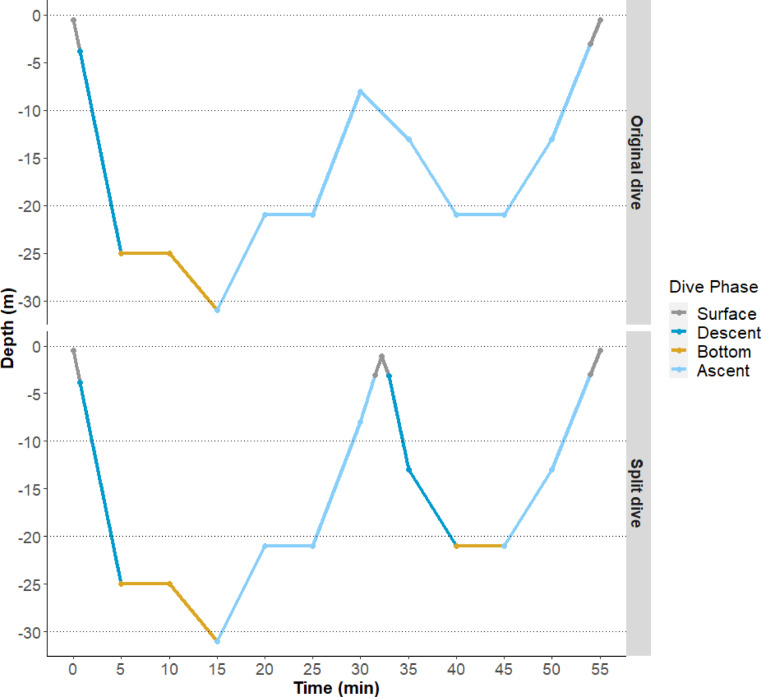
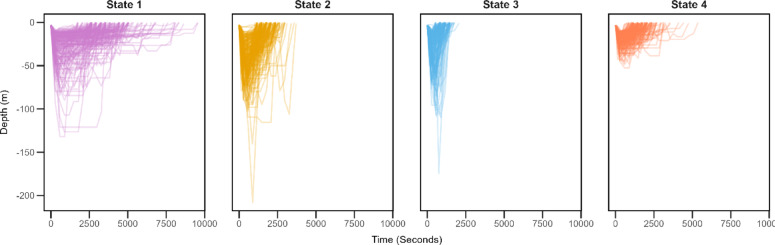
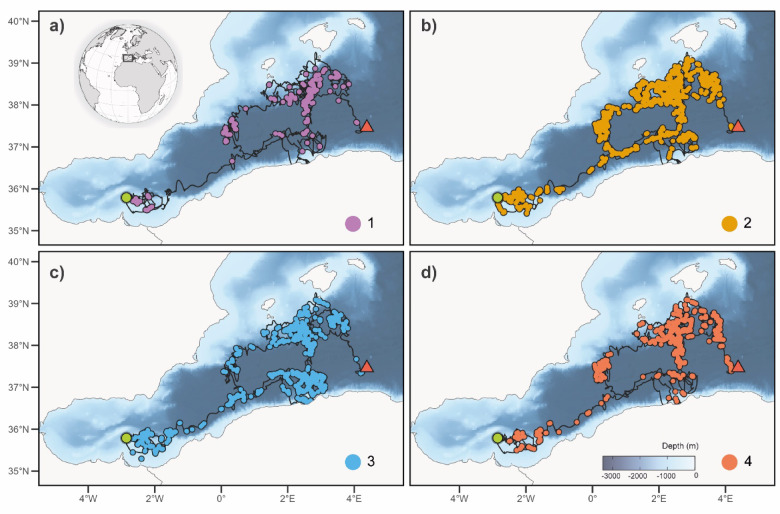
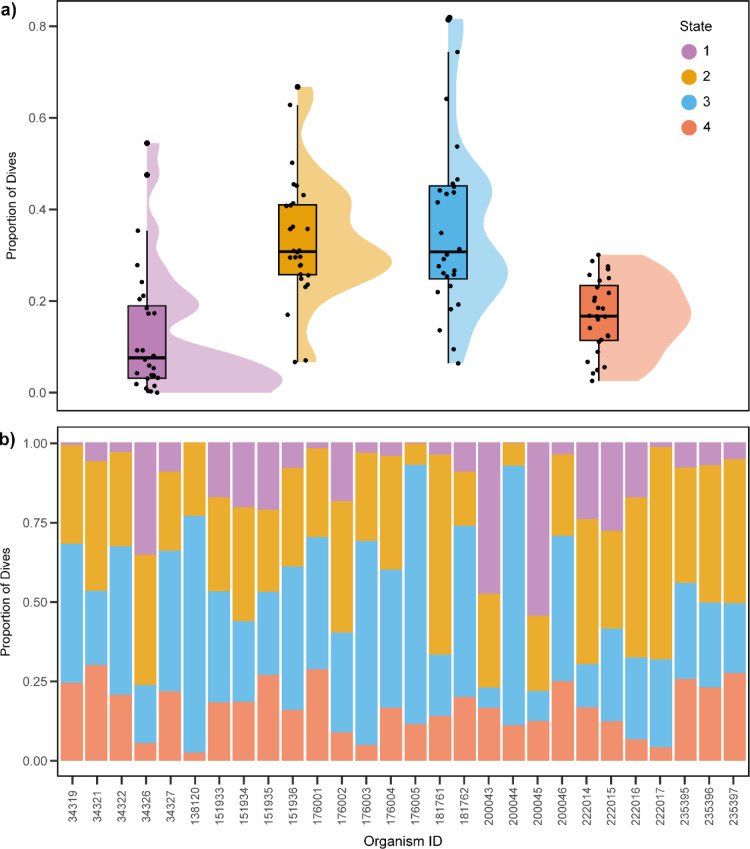
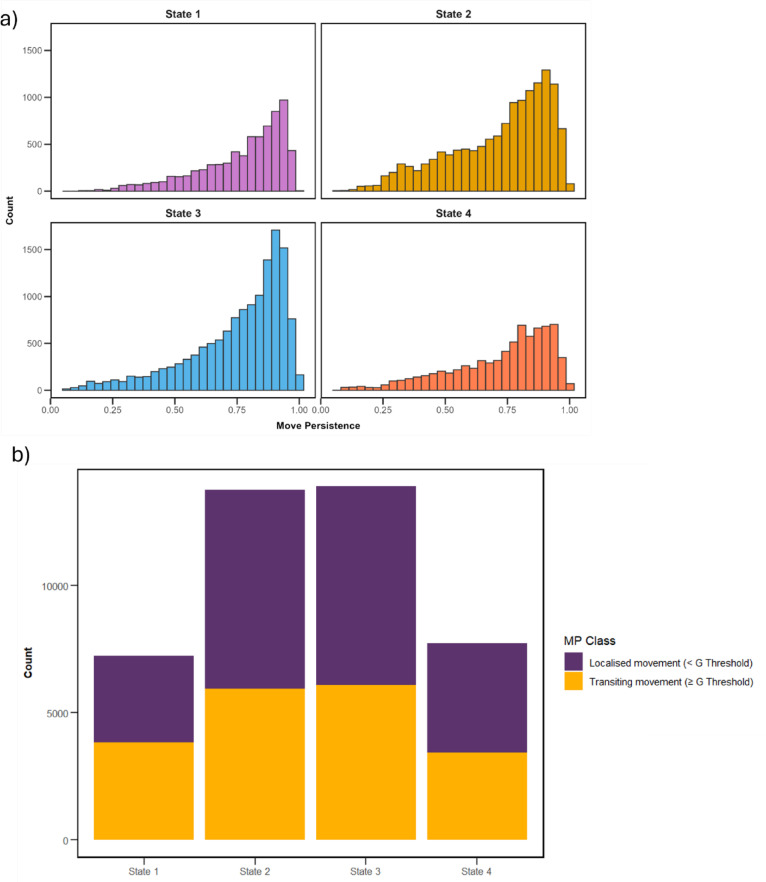
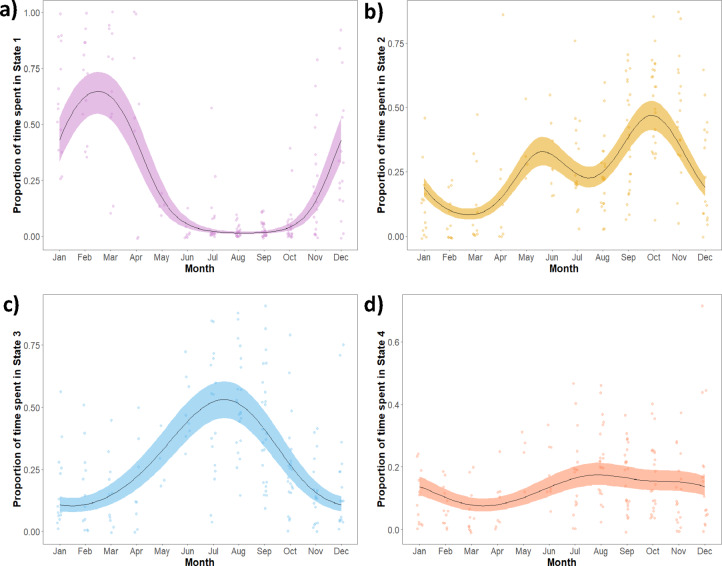
Biologging is a rapidly advancing field providing information on previously unexplored aspects of animal ecology, including the vertical movement dimension. Understanding vertical behaviour through the use of time-depth recorders (TDRs) in marine vertebrates is critical to aid conservation and management decisions. However, using TDRs can be particularly problematic to infer animal behaviour from elusive animals, when tags are difficult to recover and collected data is satellite-relayed at lower temporal frequencies. Here, we present a novel method to process low-resolution TDR data at 5-minute intervals and infer diving behaviour from loggerhead turtles (Caretta caretta) during their elusive pelagic life stage spanning extended periods (> 250 days). Using a Hidden Markov Model (HMM) we identify four behavioural states, associated with resting, foraging, shallow exploration, and deep exploration. Three of the four behavioural states were found to have strong seasonal patterns, corroborating with known sea-turtle biology. The results presented provide a novel way of interpreting low-resolution TDR data and provide a unique insight into sea turtle ecology.
Keywords: Dive analysis; Hidden Markov model; Loggerhead turtle; Seasonal behaviour; Telemetry.
© 2025. The Author(s).
Conflict of interest statement
Declarations. Competing interests: The authors declare no competing interests.
Figures
Similar articles
-
The diving behaviour of green turtles undertaking oceanic migration to and from Ascension Island: dive durations, dive profiles and depth distribution.J Exp Biol. 2001 Dec;204(Pt 23):4093-8. doi: 10.1242/jeb.204.23.4093. J Exp Biol. 2001. PMID: 11809783
-
Loggerhead sea turtle (Caretta caretta) diving changes with productivity, behavioral mode, and sea surface temperature.PLoS One. 2019 Aug 7;14(8):e0220372. doi: 10.1371/journal.pone.0220372. eCollection 2019. PLoS One. 2019. PMID: 31390354 Free PMC article.
-
Heart rate reduction during voluntary deep diving in free-ranging loggerhead sea turtles.J Exp Biol. 2024 Mar 1;227(5):jeb246334. doi: 10.1242/jeb.246334. Epub 2024 Mar 5. J Exp Biol. 2024. PMID: 38442390 Free PMC article.
-
Optimization of swim depth across diverse taxa during horizontal travel.Proc Natl Acad Sci U S A. 2024 Dec 24;121(52):e2413768121. doi: 10.1073/pnas.2413768121. Epub 2024 Dec 16. Proc Natl Acad Sci U S A. 2024. PMID: 39680775 Free PMC article.
-
Navigating uncertain waters: a critical review of inferring foraging behaviour from location and dive data in pinnipeds.Mov Ecol. 2016 Oct 26;4:25. doi: 10.1186/s40462-016-0090-9. eCollection 2016. Mov Ecol. 2016. PMID: 27800161 Free PMC article. Review.
References
-
- Hart, K. M. & Hyrenbach, K. D. Satellite telemetry of marine megavertebrates: the coming of age of an experimental science. Endanger. Species Res.10, 9–20 (2009).
-
- Bograd, S. J., Block, B. A., Costa, D. P. & Godley, B. J. Biologging technologies: new tools for conservation. Introduction. Endanger. Species Res.10, 1–7 (2010).
-
- McGowan, J. et al. Integrating research using animal-borne telemetry with the needs of conservation management. J. Appl. Ecol.54, 423–429 (2017).
-
- Hindell, M. A. et al. Tracking of marine predators to protect Southern ocean ecosystems. Nature580, 87–92 (2020). - PubMed
-
- Watanabe, Y. Y. & Papastamatiou, Y. P. Biologging and biotelemetry: tools for Understanding the lives and environments of marine animals. Annu. Rev. Anim. Biosci.11, 247–267 (2023). - PubMed
MeSH terms
LinkOut - more resources
Full Text Sources
