. 2025 Aug;31(8):2691-2702.
doi: 10.1038/s41591-025-03747-y. Epub 2025 Jun 6.

A multimodal vision foundation model for clinical dermatology

Affiliations

A multimodal vision foundation model for clinical dermatology

Siyuan Yan et al. Nat Med. 2025 Aug.

Abstract

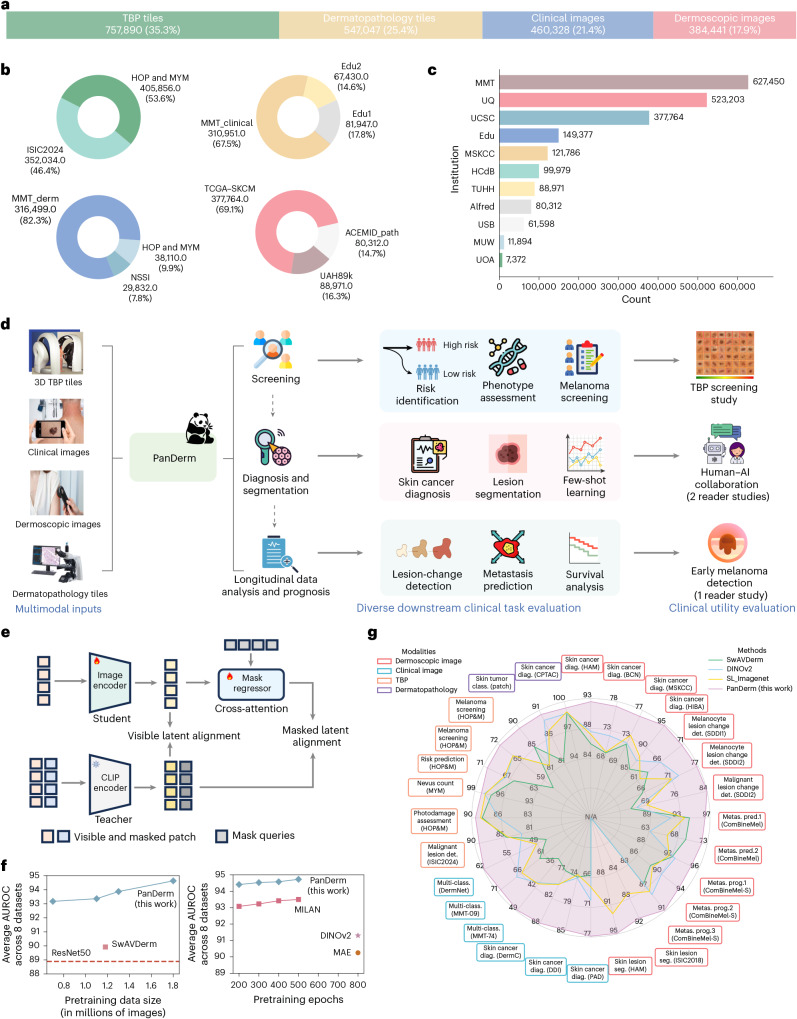
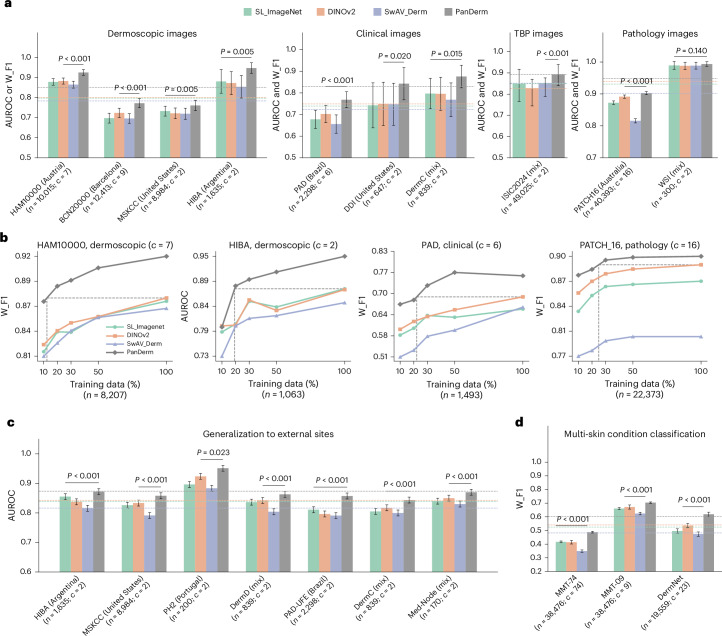
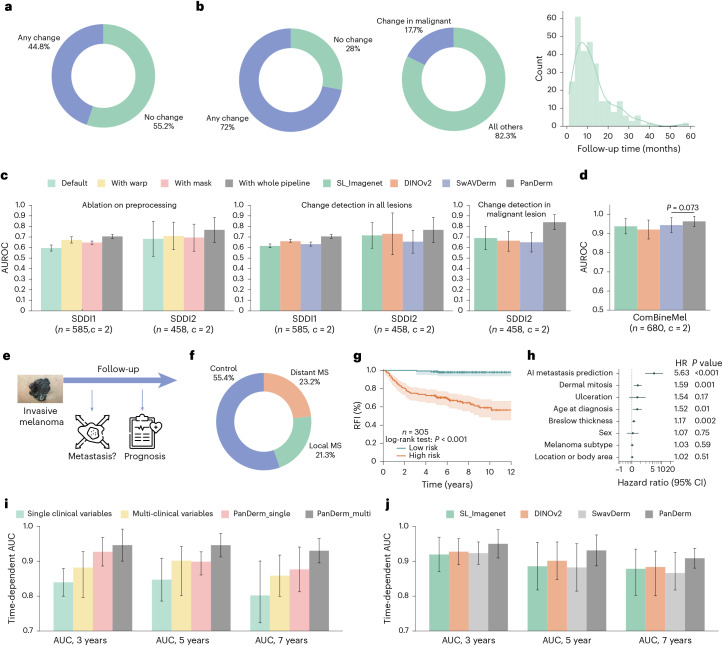
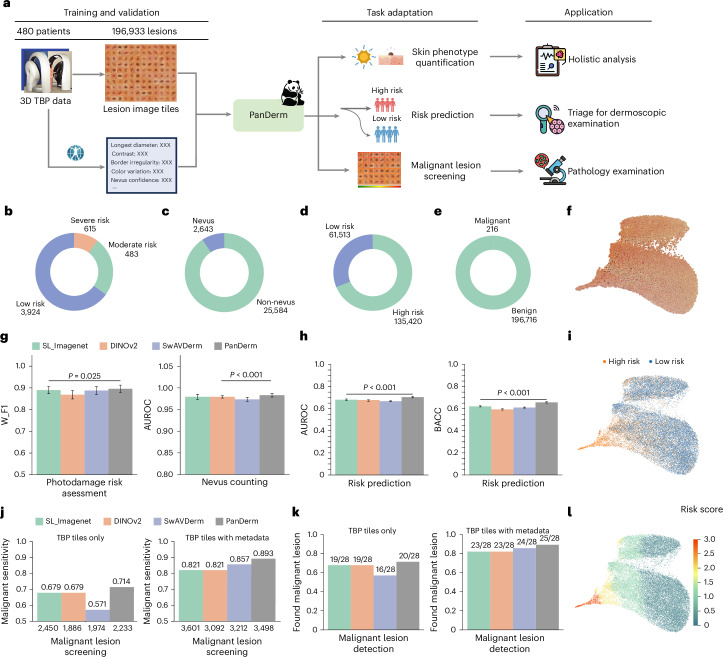
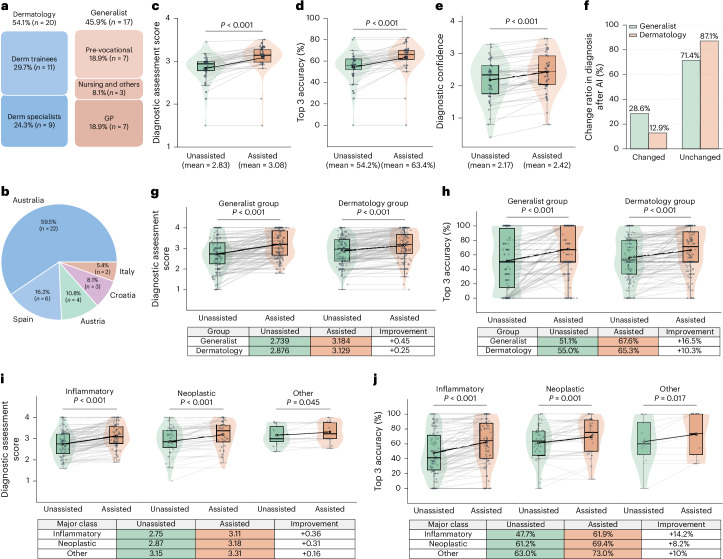
Diagnosing and treating skin diseases require advanced visual skills across domains and the ability to synthesize information from multiple imaging modalities. While current deep learning models excel at specific tasks such as skin cancer diagnosis from dermoscopic images, they struggle to meet the complex, multimodal requirements of clinical practice. Here we introduce PanDerm, a multimodal dermatology foundation model pretrained through self-supervised learning on over 2 million real-world skin disease images from 11 clinical institutions across 4 imaging modalities. We evaluated PanDerm on 28 diverse benchmarks, including skin cancer screening, risk stratification, differential diagnosis of common and rare skin conditions, lesion segmentation, longitudinal monitoring, and metastasis prediction and prognosis. PanDerm achieved state-of-the-art performance across all evaluated tasks, often outperforming existing models when using only 10% of labeled data. We conducted three reader studies to assess PanDerm's potential clinical utility. PanDerm outperformed clinicians by 10.2% in early-stage melanoma detection through longitudinal analysis, improved clinicians' skin cancer diagnostic accuracy by 11% on dermoscopy images and enhanced nondermatologist healthcare providers' differential diagnosis by 16.5% across 128 skin conditions on clinical photographs. These results show PanDerm's potential to improve patient care across diverse clinical scenarios and serve as a model for developing multimodal foundation models in other medical specialties, potentially accelerating the integration of artificial intelligence support in healthcare.


Conflict of interest statement

Competing interests: Z.G., V.M., H.P.S., M.J. and P.G. are chief investigators for the Australian Centre of Excellence for Melanoma Imaging and Diagnosis (ACEMID), which was established via an Australian Cancer Research Foundation Major Infrastructure Grant, with research activities supported by NHMRC grants (Cohort Study Grant APP2001517, Centre of Research Excellence Grant APP2044753, Synergy Grant APP2009923) and MRFF Targeted Health System and Community Organisation Research Grant (APP1175082). Z.G. is on the scientific advisory board and a consultant for Optain Health. Although Airdoc has philanthropic donation to the AIM for Health Lab, the company was not involved in any aspect of this research. H.P.S. reported equity in e-derm-consult GmbH and MoleMap NZ Limited, consulting fees from Canfield Scientific Inc and a patent (PCT/AU/2013/000394) licensed to Trajan Medical and Scientific via Uniquest, all outside the submitted work. He is also an executive board member of the International Dermoscopy Society and the Australian Melanoma Clinical Outcome Registry. M.J. holds National Health and Medical Research Council (NHMRC) TRIP Fellowships (APP2006551, APP2009923 and APP2034422). P.T. has received speaker fees from AbbVie and unrestricted educational grants from Lilly. He is an executive board member of the International Dermoscopy Society and past president of the Austrian Society of Dermatopathology. S.S., V.T. and A.B.N. are employees of NVIDIA and own Restricted Stocks. H.K. has received speaker fees from Fotofinder, MSD, Novartis and Pelpharma; license fees from Casio; and equipment from Fotofinder, Casio and Heine. He has served as an advisor for Fotofinder, La Roche-Posay and AI Medical Technology, and is a member of the executive board of the International Dermoscopy Society. P.G. has received honoraria from Metaoptima PTY and travel stipend from L’Oreal. V.M. is supported by an NHMRC Investigator Grant (APP2034976). V.M. has received Victorian Medical Research Acceleration Fund support for the SMARTI Trial with matched contribution from MoleMap; speaker fees from Novartis, Bristol Myers Squibb, Merck and Janssen; and conference travel support from L’Oreal and has participated in advisory boards for MSD, L’Oreal and SkylineDx. V.M. is a board member of the Melanoma and Skin Cancer Trials Group and an advisory member for the Melanoma and Skin Cancer Advocacy Network. The other authors declare no competing interests.

Figures

Fig. 1
Fig. 1. Overview of this study.
ac, Pretraining dataset: 2.1 million dermatological images from 11 clinical sources across 4 modalities, shown by modality (a), source (b) and institution (c). d, PanDerm interprets multiple imaging modalities for various dermatology tasks, evaluated in real-world melanoma screening and three reader studies. Image types include dermatopathology (microscopic biopsy specimens), clinical (wide-field lesion and surrounding skin), dermoscopic (close-up dermoscope images) and TBP tiles (lesion crops). e, Architecture: ViT-large encoder, regressor and CLIP-based teacher model, with representation reconstruction and CLIP latent alignment objectives. f, Performance versus pretraining data size and epochs (average AUROC on 8 benchmarks) compared with alternative strategies. g, PanDerm outperforms existing models on 28 evaluation datasets across 4 modalities. All icons in d are from Flaticon.com, except for the risk stratification, lesion change detection and survival analysis icons, which are from Microsoft PowerPoint.
Fig. 2
Fig. 2. PanDerm’s versatile capacity in diverse diagnosis tasks.
a, Performance comparison of PanDerm versus other pretrained models on 10 pigmented skin lesion datasets across multiple centers and modalities. n, data size; c, class number. Metrics: AUROC for binary class (c = 2) and W_F1 score for multi-class (c > 2) datasets. The dashed lines indicate the average model performance across datasets. b, Comparison between PanDerm and other pretrained models in label efficiency generalization on four representative datasets, showing performance at various training data percentages. The vertical dashed lines indicate the data quantity needed for PanDerm to match existing model performance. c, External validation for melanoma diagnosis across 7 datasets. d, Performance evaluation of general skin condition classification (up to 74 classes) using clinical images. The error bars in a, c and d show 95% CIs; bar centers in a, c and d represent mean values; dots in b represent mean values. Estimates were computed using nonparametric bootstrapping with 1,000 bootstrap replicates. P values were calculated using a two-sided t-test.
Fig. 3
Fig. 3. Short-term lesion change detection and metastasis prognosis results.
a, SDDI1 dataset (n = 585 dermoscopic images) statistics: ratio of changed lesions, ratio of changed malignant lesions during follow-up, and follow-up time distribution. b, Ratio of changed lesions in the SDDI2 dataset (n = 458 dermoscopic images). c, Ablation study on preprocessing methods using SDDI1 and SDDI2 ‘Default’ (direct input), ‘With warp’ (registration only), ‘With mask’ (lesion segmentation) and ‘With whole pipeline’ (complete preprocessing as in Extended Data Fig. 3). For change detection in SDDI1 and SDDI2, all models were evaluated using the whole preprocessing pipeline. d, Performance of binary metastasis prediction (control versus metastasis) in ComBineMel (n = 680 dermoscopic images) by AUROC. e, Scheme of PanDerm for melanoma metastasis and prognosis prediction. MS, metastasis. f, Distribution of metastasis types in the ComBineMel dataset (n = 680 dermoscopic images). g, Kaplan–Meier curves for the RFI in invasive melanoma patients (ComBineMel (n = 305 patients)), stratified by PanDerm prediction scores. h, Forest plot of HRs for PanDerm; stratified groups in invasive melanoma patients. i, Time-dependent AUC of PanDerm versus clinical variable score combinations in ComBineMel. j, Time-dependent AUC comparison of PanDerm and other pretrained models in ComBineMel. The error bars in c, d, i and j and error bands in g show 95% CIs; the bar centers indicate means. All estimates were derived from fivefold cross-validation. P values in d were derived from two-sided t-tests and those in h from Wald tests within Cox proportional hazards models. Icons in e from Flaticon.com.
Fig. 4
Fig. 4. Skin phenotype assessment and malignant lesion screening using TBP.
a, Illustration of PanDerm processing multimodal TBP data for skin phenotype quantification, risk prediction and malignant lesion screening. b,c, Class distribution of skin phenotype quantification for photodamage risk assessment (n = 5,022 TBP tiles) (b) and nevus counting (n = 28,227 TBP tiles) (c) in datasets. d,e, Class distribution of risk prediction (d) and benign and malignant lesions (n = 196,933 TBP tiles) (e). g, Photodamage risk assessment and nevus counting performance by W_F1 and AUROC. h, Risk prediction performance by AUROC and BACC. Error bars in g and h show 95% CIs; bar centers represent mean values. Estimates were computed with nonparametric bootstrapping using 1,000 bootstrap replicates. P values were calculated with a two-sided t-test. j, Malignant lesion screening performance by sensitivity. Left: using only TBP data; right: integrating measurement information. The numbers below the bars indicate the recommended suspicious lesion count. k, Number of malignant lesions detected in the test set. f, UMAP plot of PanDerm screening results for test lesions. i, UMAP plot of human screening results for test lesions. l, UMAP plot of PanDerm risk prediction results for test lesions. All icons in a are from Flaticon.com, except the risk prediction icon, which is from Microsoft PowerPoint.
Fig. 5
Fig. 5. Performance of PanDerm in human–AI collaborative skin cancer diagnosis using dermoscopic images.
a, Reader study overview: 41 users answered 3,320 questions on the ISIC2018 Task 3 test set (n = 1,511 images, 7 classes). b, Diagnostic accuracy comparison: without versus with PanDerm support (P < 0.001; two-sided paired t-test; n = 41 readers). c, Accuracy comparison without versus with PanDerm by experience level based on experience per experience: low (n = 11), medium (n = 21) and high (n = 9). d, Accuracy comparison without versus with PanDerm by diagnostic class based on readings per class: MEL (n = 332), BCC (n = 166), AKIEC (n = 166), BKL (n = 166), NV (n = 498), DF (n = 166) and VASC (n = 166). The error bars represent 95% CIs; bar centers represent means.
Fig. 6
Fig. 6. Performance of PanDerm in human–AI collaborative assessment of 128 skin conditions using clinical images.
a, Reader demographics (n = 37 readers): dermatology group (n = 20 readers) including residents and specialists, and generalist group (n = 17 readers) including pre-vocational trainees, general practitioners, nurses and clinical trial assistants. Each reviewed up to 50 of 200 cases. b, Geographic distribution of readers. ce, Reader-wise analysis (each data point represents one reader, n = 37 readers): comparisons without versus with PanDerm support for: top 1 diagnostic assessment score (1–4) (c), top 3 diagnostic accuracy (d) and diagnostic confidence score (1–4) (e). f, Diagnosis change ratio after PanDerm support by specialization group. g,h, Class-wise analysis (each data point represents one skin condition class): comparisons without versus with PanDerm support by specialization groups for the top 1 diagnostic assessment score (1–4) (g) and top 3 diagnostic accuracy (h) (n = 128 classes per group). i,j, Comparisons without versus with PanDerm support by disease category for the top 1 diagnostic assessment score (1–4) (i) and the top 3 diagnostic accuracy (j), stratified by inflammatory (n = 78 classes), neoplastic (n = 37 classes) and other (n = 13 classes) conditions. P values in ce were calculated using two-sided paired t-test across readers, while P values in gj were calculated using two-sided paired t-test across classes. In all the boxplots, the horizontal lines represent medians and the white dots represent means. The upper and lower box limits indicate the 1st and 3rd quartiles, with whiskers extending to 1.5 times the interquartile range. Error bars represent 95% CIs.
Extended Data Fig. 1
Extended Data Fig. 1. Performance of PanDerm versus other pretrained models on 10 pigmented skin lesion datasets across multiple centers and modalities.
a. Performances are measured by weighted F1 (W F1). b. Performances are measured by AUROC. c. Performances are measured by AUPR. d. Perfor- mances are measured by BACC. n: data size, c: class number. Dashed lines show the average performance of each model across different datasets. Estimates were computed using nonparametric bootstrapping with 1000 bootstrap replicates. P-values calculated using a two-sided t-test. Error bar, 95% CIs; bar centers, means.
Extended Data Fig. 2
Extended Data Fig. 2. Label efficiency generalization results on additional tasks.
a. Label efficiency analysis for photodamage risk assessment using Total Body Photography (TBP) images. Results demonstrate model performance with limited labeled data available. PanDerm outperformed the second-best models using only 10% of labeled images. b. Label efficiency analysis for melanoma classification using whole slide dermatopathology images. Results illustrate model performance with limited labeled data. PanDerm surpassed the second-best models using less than 30% of labeled images.
Extended Data Fig. 3
Extended Data Fig. 3. Longitudinal dermoscopic image-based lesion change detection using PanDerm.
For comparing subtle changes in paired lesions during short-term follow-up (for example, 3 months), images undergo dark corner detection and removal, skin inpainting, registration, and lesion segmentation. This allows models to focus on subtle differences between lesions at different time points. Panda icon from Flaticon.com.
Extended Data Fig. 4
Extended Data Fig. 4. SHAP (SHapley Additive exPlanations) value plot.
It shows the impact of various measurement variables captured by the 3D TBP machine on the model output. The plot displays the relative importance and directional influence of each feature, with colors indicating high (red) to low (blue) feature values, and the x-axis representing the SHAP value or impact on the model’s prediction. Features are ordered by their overall importance, with ‘nevi confidence’ having the highest impact and ‘stdLExt’ the lowest.
Extended Data Fig. 5
Extended Data Fig. 5. Quantitative skin lesion segmentation results.
a, b. Segmentation performance measured by dice score (DSC) and Jaccard index (JAC) for PanDerm and baseline models on ISIC2018 (n=2,074 dermoscopic images) and HAM10000 (n=7,011 dermoscopic images) datasets. c, d. Label efficiency generalization performance for PanDerm and baselines, showing mean DSC and JAC on ISIC2018 and HAM10000 datasets. Error bars in a, b indicate 95% confidence intervals; bar centers represent mean values; points in c, d denote mean values. All estimates are derived from five replicas with different seeds. Statistical significance was assessed using two-sided t-tests.
Extended Data Fig. 6
Extended Data Fig. 6. Qualitative skin lesion segmentation results.
a. Comparison of PanDerm against baseline models on challenging examples from HAM10000. Red contours indicate ground truth masks, while cyan contours show model predictions. b. PanDerm segmentation results on a random selection of images from HAM10000.
Extended Data Fig. 7
Extended Data Fig. 7. Early melanoma detection results (reader study 1).
Comparing PanDerm to 12 clinicians (7 experienced dermatologists, 5 dermatology residents). X-axis: 89 melanoma lesion IDs; Y-axis: lesion image sequence length. Points on the histogram represent the initial time points of correct melanoma diagnoses. Points below y=0 correspond to melanoma lesions undetected throughout the sequence.
Extended Data Fig. 8
Extended Data Fig. 8. Sunburst plot of standard ontology on SD-128 dataset.
Four experienced dermatologists collaboratively developed the standard ontology to systematically categorize the 128 skin conditions and facilitate expert evaluation in reader study3.
Extended Data Fig. 9
Extended Data Fig. 9. Demographic distribution of participants in reader study 3.
a. Specialty distribution of participants. b. Career stage distribution of participants. c. Experience levels distribution by years.

References

    1. Kittler, H., Pehamberger, H., Wolff, K. & Binder, M. Diagnostic accuracy of dermoscopy. Lancet Oncol.3 3, 159–65 (2002). - PubMed
    1. Primiero, C. A. et al. A narrative review: opportunities and challenges in artificial intelligence skin image analyses using total body photography. J. Invest. Dermatol.144, 1200–1207 (2024). - PubMed
    1. Primiero, C. A. et al. A protocol for annotation of total body photography for machine learning to analyze skin phenotype and lesion classification. Front. Med.11, 1380984 (2024). - PMC - PubMed
    1. Olsen, C. M. et al. Risk stratification for melanoma: models derived and validated in a purpose-designed prospective cohort. J. Natl Cancer Inst.110, 1075–1083 (2018). - PubMed
    1. Usher-Smith, J. A., Emery, J., Kassianos, A. P. & Walter, F. M. Risk prediction models for melanoma: a systematic review. Cancer Epidemiol. Biomark. Prev.23, 1450–1463 (2014). - PubMed

LinkOut - more resources