. 2025 Jul;6(7):1283-1294.
doi: 10.1038/s43018-025-00976-5. Epub 2025 Jun 6.

crossNN is an explainable framework for cross-platform DNA methylation-based classification of tumors

Affiliations

crossNN is an explainable framework for cross-platform DNA methylation-based classification of tumors

Dongsheng Yuan et al. Nat Cancer. 2025 Jul.

Abstract

DNA methylation-based classification of (brain) tumors has emerged as a powerful and indispensable diagnostic technique. Initial implementations used methylation microarrays for data generation, while most current classifiers rely on a fixed methylation feature space. This makes them incompatible with other platforms, especially different flavors of DNA sequencing. Here, we describe crossNN, a neural network-based machine learning framework that can accurately classify tumors using sparse methylomes obtained on different platforms and with different epigenome coverage and sequencing depth. It outperforms other deep and conventional machine learning models regarding accuracy and computational requirements while still being explainable. We use crossNN to train a pan-cancer classifier that can discriminate more than 170 tumor types across all organ sites. Validation in more than 5,000 tumors profiled on different platforms, including nanopore and targeted bisulfite sequencing, demonstrates its robustness and scalability with 99.1% and 97.8% precision for the brain tumor and pan-cancer models, respectively.


Conflict of interest statement

Competing interests: D.C. is a shareholder and cofounder of Heidelberg Epignostix. All other authors declare no competing interests.

Figures

Fig. 1
Fig. 1. crossNN model architecture, training and CV.
a, Overview of the model architecture. b, Heatmap of confusion matrix in fivefold CV. ATRT, atypical teratoid/rhabdoid tumor; ENB, esthesioneuroblastoma; MB, medulloblastoma; MB G3G4, MB group 3 and group 4; RRBS, reduced representation bisulfite sequencing; RTK, receptor tyrosine kinase (I, II and III). Source data
Fig. 2
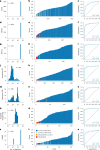
Fig. 2. Classification results in the 450K, EPIC/EPICv2, nanopore, targeted methyl-seq and WGBS validation cohorts.
a,d,g,j,m,p,s, Predictions for 2,090 samples are shown (450K n = 610 (a), EPICv1 n = 554 (d), EPICv2 n = 133 (g), nanopore R9 n = 415 (j), nanopore R10 n = 129 (m), targeted sequencing n = 124 (p), WGBS n = 125 (s)). The distribution of the number of CpG features used as input to the crossNN model is shown. b,e,h,k,n,q,t, Waterfall plots of cohorts with samples ranked according to the confidence score. The dashed lines indicate platform-specific cutoff values chosen based on fivefold CV. c,f,i,l,o,r,u, Receiver operator characteristics of confidence scores regarding the correct classification on MC versus MCF level.
Fig. 3
Fig. 3. Interpretability of the model.
a, Typical bimodal distribution of feature weights. As an example, the distribution of feature weight values (n = 366,263 features) for the MC oligodendroglioma, IDH-mutant and 1p/19 code-deleted (IDH-mutant oligodendroglioma) are shown. The blue shading of the AUC indicates the top 5% of features ranked according to absolute weight. b, Heatmap illustrating the methylation levels (beta value) of the top ten CpG sites per MC (n = 91 classes), ranked according to feature weight in the final prediction model. For illustration, only features with a positive weight were considered during ranking. c, Clustered heatmap of the top 200 features ranked according to the absolute weight for each of the MB subtypes. Genes associated with Wnt signaling according to Gene Ontology terms are annotated. d, Annotation and summary of regulatory elements overlapping the top 1,000 positively and negatively weighted features per MC (n = 91 classes). e,f, Importance of class-specific features with respect to genomic context. e, The differential promoter methylation of LDHA was identified using feature ranking as a distinct feature of oligodendroglioma. The average beta values from oligodendrogliomas (n = 80 cases) versus all other reference samples (n = 2,721 cases) are shown. f, Conversely, the MUM1/PWWP3A gene was identified as a marker gene for the MC ‘high grade neuroepithelial tumors with MN1 alterations’ (HGNET-MN1) using the ranking of feature weights aggregated at the gene level. Differential hypomethylation was observed in the gene body, but not in a proximal CpG island (lower track). The average beta values from HGNET-MN1 (n = 21 cases) versus all other reference samples (n = 2,780 cases) are shown. AD, adolescent; CHL, child; INF, infantile; SHH, Sonic hedgehog. Source data
Fig. 4
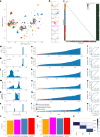
Fig. 4. Validation of a crossNN pan-cancer classifier.
a,b, Overview of the pan-cancer training dataset. Uniform manifold approximation and projection (UMAP) dimensionality reduction depicts the reference dataset of 8,382 reference tumors (a), including four major groups of tumors (b). c, Confusion matrix showing the internal validation of the crossNN pan-cancer model (n = 8,382 training samples). du, Independent validation of the model across different platforms. d,g,j,m,p,s, Distribution of the number of CpG features used as input to the crossNN model: 450K (d), EPIC (g), nanopore R9 (j), nanopore R10 (m), targeted sequencing (p) and WGBS (s). e,h,k,n,q,t, Waterfall plots of cohorts with samples ranked according to confidence score. The dashed lines indicate platform-specific cutoff values chosen based on fivefold CV. f,i,l,o,r,u, Receiver operating characteristics of confidence scores regarding the correct classification on MC versus MCF level. v,w, Accuracy (v) and precision (w) in the validation cohort per major tumor group across all platforms (carcinoma n = 3,005, hematolymphoid n = 32, neuroepithelial n = 2,079, sarcoma n = 263 cases, respectively). x, Classification of renal cell carcinoma. The confusion matrix shows fractions relative to the total number of cases per subtype (kidney chromophobe renal cell carcinoma (KICH) n = 20, kidney renal clear cell carcinoma (KIRC) n = 107, kidney renal papillary carcinoma (KIRP) n = 86 cases, respectively). The columns indicate the ground truth, the rows indicate the crossNN predictions. BLCA, bladder urothelial carcinoma. Source data
Extended Data Fig. 1
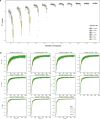
Extended Data Fig. 1. Identification of optimal sampling rate and number of epochs for training crossNN.
(a) Comparison of F1 score for various sampling rates via 5-fold cross validation (5xCV) with different numbers of features. Each box plot indicates median F1 score (center line), inter-quartile range (box) and 1.5fold interquartile range (whiskers). Outliers are indicated by dots. Downsampling and 5xCV were performed 10 times for the given number of features. (b) F1 score vs. number of epochs in 5xCV for a given number of features that the training set has been downsampled to. Source data
Extended Data Fig. 2
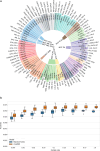
Extended Data Fig. 2. Model performance in 5-fold cross validation (CV) of the 450 K training set.
Model performance in 5-fold cross validation (5xCV) of the 450 K training set. (a) Accuracy for each individual methylation class and methylation class family (MCF) during 5-fold CV. (b) Overall accuracy of the crossNN model in 5xCV of the training set. Validation folds were subsampled at the indicated rate to simulate sparse methylomes. Random sampling and 5xCV were repeated ten times at each sample rate. Box plots indicate median accuracy (center line), inter-quartile range (box) and 1.5fold interquartile range (whiskers). Outliers are indicated by dots. Source data
Extended Data Fig. 3
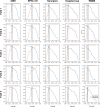
Extended Data Fig. 3. Identification of optimal platform-specific cut-off values for prediction scores of the brain tumor model.
Plots show receiver operating characteristics (ROC) of MCF scores for individual folds in 5-fold cross-validation. Dashed vertical lines indicate Youden index, dashed-dotted lines indicate final chosen cut-off. MCF, methylation class family. Source data
Extended Data Fig. 4
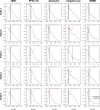
Extended Data Fig. 4. Identification of optimal platform-specific cut-off values for prediction scores of the pan-cancer model.
Plots show receiver operating characteristics (ROC) characteristics of MCF scores for individual folds in 5-fold cross-validation. Dashed vertical lines indicate Youden index, dashed-dotted lines indicate final chosen cut-off. MCF, methylation class family. Source data

References

    1. Klutstein, M., Nejman, D., Greenfield, R. & Cedar, H. DNA methylation in cancer and aging. Cancer Res.76, 3446–3450 (2016). - PubMed
    1. Lokk, K. et al. DNA methylome profiling of human tissues identifies global and tissue-specific methylation patterns. Genome Biol.15, 3248 (2014). - PMC - PubMed
    1. Nishiyama, A. & Nakanishi, M. Navigating the DNA methylation landscape of cancer. Trends Genet.37, 1012–1027 (2021). - PubMed
    1. Locke, W. J. et al. DNA methylation cancer biomarkers: translation to the clinic. Front. Genet.10, 1150 (2019). - PMC - PubMed
    1. Papanicolau-Sengos, A. & Aldape, K. DNA methylation profiling: an emerging paradigm for cancer diagnosis. Annu. Rev. Pathol.17, 295–321 (2022). - PubMed

LinkOut - more resources