. 2025 Jul;22(7):1505-1519.
doi: 10.1038/s41592-025-02721-3. Epub 2025 Jun 6.

CellNEST reveals cell-cell relay networks using attention mechanisms on spatial transcriptomics

Affiliations

CellNEST reveals cell-cell relay networks using attention mechanisms on spatial transcriptomics

Fatema Tuz Zohora et al. Nat Methods. 2025 Jul.

Abstract

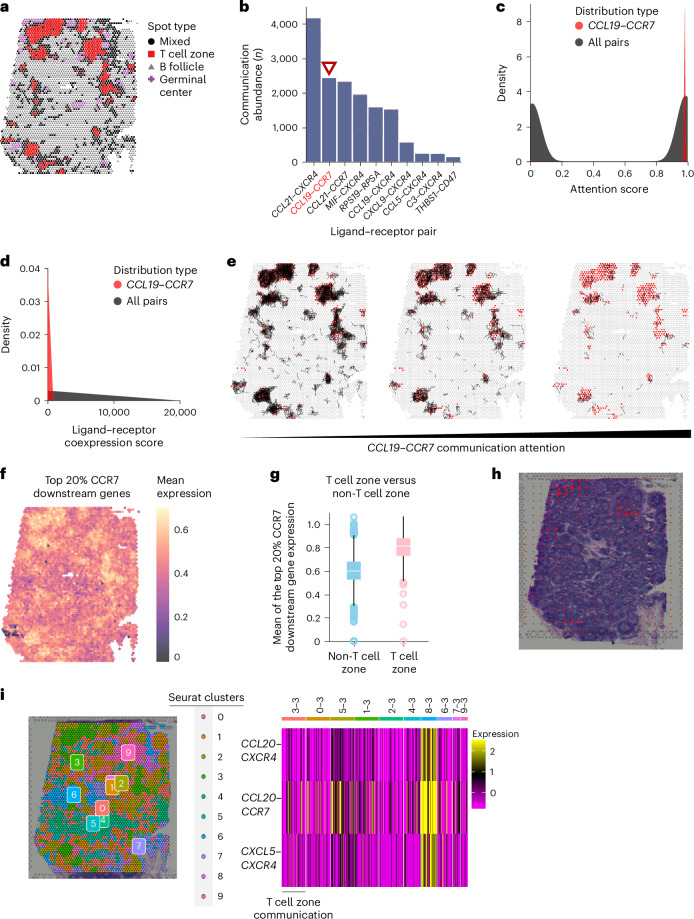
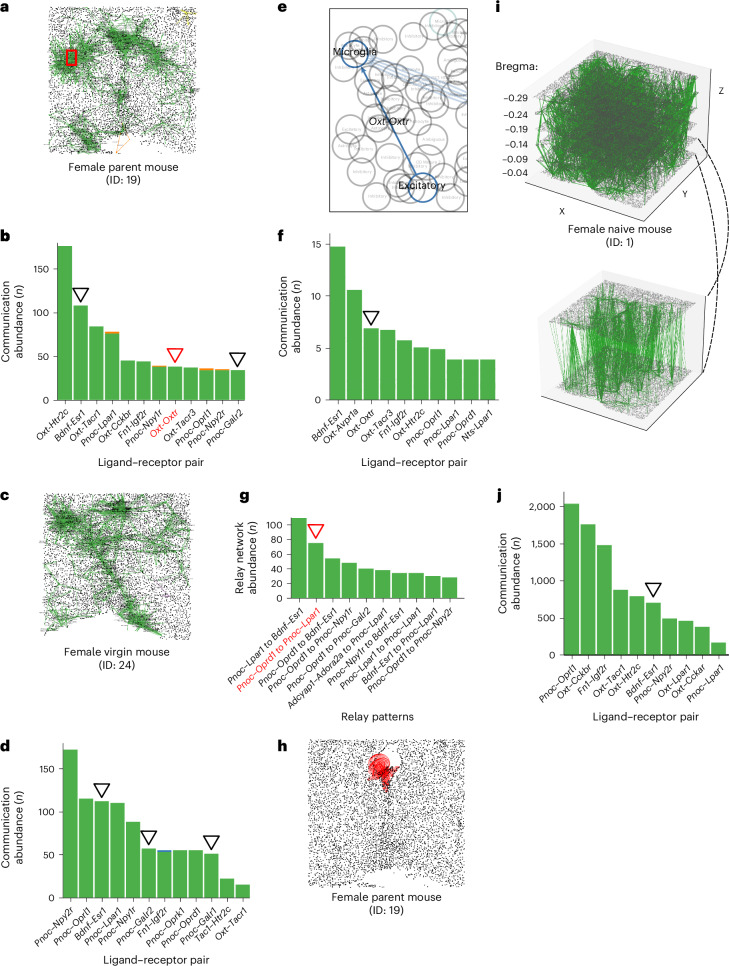
Dysregulation of communication between cells mediates complex diseases such as cancer and diabetes; however, detecting cell-cell communication at scale remains one of the greatest challenges in transcriptomics. Most current single-cell RNA sequencing and spatial transcriptomics computational approaches exhibit high false-positive rates, do not detect signals between individual cells and only identify single ligand-receptor communication. To overcome these challenges, we developed Cell Neural Networks on Spatial Transcriptomics (CellNEST) to decipher patterns of communication. Our model introduces a new type of relay-network communication detection that identifies putative ligand-receptor-ligand-receptor communication. CellNEST detects T cell homing signals in human lymph nodes, identifies aggressive cancer communication in lung adenocarcinoma and colorectal cancer, and predicts new patterns of communication that may act as relay networks in pancreatic cancer. Along with CellNEST, we provide a web-based, interactive visualization method to explore in situ communication. CellNEST is available at https://github.com/schwartzlab-methods/CellNEST .


Conflict of interest statement

Competing interests: The authors declare no competing interests.

Figures

Fig. 1
Fig. 1. Overview of detecting cell–cell communication with CellNEST.
a, A high-level flowchart of the main steps of the CellNEST method. b, Input tissue sample at either spot (for example, Visium; top) or cell resolution (for example, MERFISH, Visium HD; bottom). UMI, unique molecular identifier. c, Input ligand–receptor database containing known ligand and cognate receptor pairings. d, Preprocessing step, where genes with expression above a threshold percentile are considered active (left). Pairwise Euclidean distances between vertices are stored in a physical distance matrix (right). e, Input graph G = (V, E) generation step with V spots or cells as vertices and E edges as neighborhood relations, some of which represent communication (bottom). An input threshold distance is used for the neighborhood formation (blue arrow). From the graph, vertex features are represented as a one-hot vector matrix (top left). The edge feature matrix holds edge feature vectors containing three attributes: pairwise distance, ligand–receptor coexpression score and the ligand–receptor pair identity from the database in c. f, Communication prediction step using a GAT encoder through unsupervised contrastive learning with DGI. g, Output graph step visualizing edges with the highest attention scores. Attention scores range from 0 (white) to 1 (black), where 1 represents the strongest connections. Lower-scoring edges are removed (dashed lines), resulting in subgraphs of communicating vertices. h, Example output showing the flow of communication between tumor-annotated spots (filled squares) with stroma spots (open circles), colored by connected component. i, An example CellNEST-generated histogram showing the frequency of communication through ligand–receptor pairs in the top 20% highest-scoring attention edges. Colors in the histogram correspond to connected components in h. For instance, the most abundant communication, labeled as FN1RPSA, is found primarily in the blue region. Altogether, CellNEST offers a high-resolution approach for detecting the strength and location of cell–cell communication in tissues.
Fig. 2
Fig. 2. CellNEST identifies T cell homing signals in human lymph node T cell zones.
a, Human lymph node tissue assayed with Visium and annotated with cell2location (n = 4,035 spots). b, Histogram of ligand–receptor pairs (x axis) with the top 20% highest attention scores in T cell zones assigned by CellNEST in descending order of abundance (y axis). CCL19–CCR7 (red text with triangle) is a canonical T cell homing signal. c, Density plot of CCL19CCR7 attention scores (red) compared to all other ligand–receptor pairs (gray) in T cell zones. d, Density plot of CCL19CCR7 ligand–receptor coexpression scores (red) compared to all other ligand–receptor pairs (gray) in T cell zones. e, Selection of the top 5,000, 2,500 and 500 CCL19CCR7 edges with the strongest attention scores (left to right) across the entire tissue. Stronger CCL19CCR7 communication is found in T cell zones. f, Mean expression of the top 20% expressed genes encoding proteins downstream of CCR7 signaling mapped onto the human lymph node, which aligns with CellNEST-detected regions in T cell zones in e. g, Box and whisker plots comparing mean gene expression from f within (n = 417 spots) or outside (n = 3,618 spots) of T cell zones. Center line, median; box, interquartile range; whiskers, 1.5 × interquartile range; points, outliers. There is elevated expression of CCR7 downstream signaling genes in T cell zones (two-sided Mann–Whitney U-test, P = 6.42 × 10−164). h, Application of COMMOT to the human lymph node, with red arrows indicating CCL19CCR7 strength. Regions do not align well with T cell zones. i, Application of NICHES to the human lymph node. Using a cluster-based analysis (left), NICHES identified three signals but missed the CCL19CCR7 signal (right).
Fig. 3
Fig. 3. CellNEST identifies relay networks of communication in spatial transcriptomic data.
a, Diagram showing the conceptual difference between a single communication between two vertices (here cells) versus a relay network involving a group of vertices. b, Histogram of the most abundant two-hop relay networks (ligand–receptor–ligand–receptor) in the T cell zone identified by CellNEST, including CCL19CCR7 (red triangle). c, CCL19–CCR7 to CCL21–CXCR4 within T cell zones in Fig. 2a (red). d, Pie charts showing the proportion of each cell type involved in the CCL19–CCR7 to CCL21–CXCR4 relay network in the T cell zone, from sender (left) to receiver and sender (middle) to second receiver (right). DC, dendritic cell; Endo, endothelial; FDC, follicular dendritic cell; ILC, innate lymphoid cell; NK, natural killer; NKT, natural killer T; TIM3, T-cell immunoglobulin and mucin domain-containing protein 3; TfR, T follicular regulatory; Treg, regulatory T; VSMC, vascular smooth muscle cell. e, Diagram showing relay network confidence scoring by integrating experimental scores of protein–protein interactions from STRING and NicheNet, as well as transcription factor–target interactions from DoRothEA. fh, Example synthetic distributions for equidistant (for example, Visium; f), uniformly (for example, MERFISH, Visium HD; g), and mixture of Gaussian and uniformly (for example, MERFISH, Visium HD; h) distributed cells. i,j, Heat maps displaying balanced accuracy of CCC methods on synthetic (i) and diffusion-based models (j) measured at single-cell resolution.
Fig. 4
Fig. 4. CellNEST identifies communication involved in mouse parental behavior in the hypothalamus preoptic region assayed with MERFISH.
a,b, CellNEST-detected communication (green) in tissue from the female parent mouse (n = 5,533 cells; a) with a corresponding histogram of the top 20% strongest ligand–receptor pairs (b). c,d, As in a and b for female virgin mouse tissue (n = 5,606 cells). CellNEST identified signals involving galanin receptor (Galr1 and Galr2) and brain-derived neurotrophic factor (Bdnf) in both parent and virgin mice (black triangle, bold). In contrast, the parenting signal OxtOxtr is exclusively found in the female parent mouse (red triangle in b). e, Cell-type-specific communication zoomed in from the red rectangle in a. f, The corresponding CellNEST-generated histograms from e showing CCC between microglia and excitatory neurons. As in b, OxtOxtr is detected (black triangle, bold) as one of the strongest communications. g,h, One of the most frequent relay-network patterns, Pnoc–Oprd1 to Pnoc–Lpar1 (red triangle), compared to the abundance of other top patterns in a histogram (g) and overlaid on the tissue (red; h). i, 3D MERFISH sample from a female naive mouse (n = 38,372 cells) with CellNEST-detected communication (top), with a zoom-in of two layers for clearer visualization (bottom). j, Histogram of top communication found in i.
Fig. 5
Fig. 5. CellNEST reveals subtype-specific patterns of communication in pancreatic ductal adenocarcinoma tissue.
a,b, Tissue from patient PDAC_64630 assayed with Visium (n = 1,406 spots) with a hematoxylin and eosin (H&E) stain (a) or colored by PDAC subtype determined with gene signatures (b). c, CellNEST-detected communicating regions from a. CellNEST output graphs show tumor (filled square) and stroma (open circle) regions. Colors correspond to different connected components. d,e, Histogram of the strongest CCC counts (y axis) determined by CellNEST across the whole tissue (d) or tumor-communicating regions (e). Colors correspond to each connected component in c. f,g, Tissue from patient PDAC_140694 assayed with Visium (n = 2,298 spots) with H&E (f) or colored by PDAC subtype determined with gene signatures (g). h,i, CellNEST-detected strongly communicating regions from f (h) with the corresponding histogram of CCC counts (i) colored by each connected component in h. Ligand–receptor pairs highlighted with bold text in d and i represent communications detected by CellNEST in both samples. PLXNB2MET/MST1R highlighted with red text in e and i represents a communication that is associated with the classical subtype in both samples by CellNEST. jm, Mean of top 20% downstream signaling gene expression of MET (PLXNB2–MET; j,k) and ITGB4 (LGALS3–ITGB4; l,m) on PDAC_64630 (j,l) and PDAC_140694 (k,m). Gene expression is high in regions where the corresponding CCCs are detected by CellNEST (black boxes).
Fig. 6
Fig. 6. Organoid validation of PDAC subtype-specific signals and example CellNEST-Interactive visualization.
a, Heat map displaying gene expression of MET, classical-associated genes and basal-like-associated genes in PDAC patient-derived organoid models assayed with bulk RNA sequencing (n = 10). b,c, Box and whisker plots comparing gene expression in basal-like (n = 5) versus classical (n = 5) organoids classified with an established subtyping scheme. Center line, median; box, interquartile range; whiskers, 1.5 × interquartile range; points, outliers. b, MET expression is significantly higher in the classical organoids (two-sided Fisher–Pitman permutation test: P = 3.18 × 10−02). c, Both classical and basal-like organoids express LGALS3 (two-sided Fisher–Pitman permutation test: P = 0.175). d,e, Histogram of the most abundant two-hop relay-network patterns (d) along with the spatial location of FN1–RPSA to FN1–RPSA (e) detected by CellNEST on the PDAC_64630 sample (n = 1,406 spots; filled square, tumor; open circle, stroma), highlighted in red. f, Overview of CellNEST-Interactive. The CellNEST-Interactive display shows a fully interactive network of vertices (cells or spots) connected by ligand–receptor pairs (left). The display features a user interface (right) with options to filter genes and select thresholds for attention scores of communication, as well as a histogram of communication abundance colored by component. Zoomed insets display a sender stroma spot and receiver tumor spot participating in FN1-SDC1 communication in the PDAC_64630 sample.
Extended Data Fig. 1
Extended Data Fig. 1. CellNEST detects localized signaling in tumor and stromal environments in lung adenocarcinoma tissue assayed with Visium.
CellNEST detects localized signaling in tumor and stromal environments in lung adenocarcinoma tissue assayed with Visium (n = 4,095 spots). a, CellNEST-generated communication graph showing regions with strong CCC colored by component. Gray indicates regions with no or weak CCC. The top right red component has thinner arrow widths to accommodate very high communication frequency. The boxes outline three regions: cancer (orange), lymph (green), and stromal (blue) based on prior histological annotations[35]. b, Histogram displaying ligand-pair receptor abundance (y axis) from a, colored by connected component. The APOE–SDC1 and FN1–RPSA signals (black triangles, bold) are exclusively detected by CellNEST. CellNEST also detects many TGFB signals (blue text). c-e, Location of specific tumor and stroma signals found in b. c, Communication from a filtered for APOE–SDC1 signals. This is the most abundant signal and is mainly found in cancer-annotated regions. d,e, Gene expression of APOE (d) and SDC1 (e) on a, found mainly in cancer regions. f,g, Distribution of CellNEST-identified relay-network patterns. f, Histogram showing the abundance of each two-hop relay-network pattern with PSAP–LRP1 to APOE–LRP1 communication highlighted in red. g, The spatial location of the PSAP–LRP1 to APOE–LRP1 pattern from f on the tissue (red).
Extended Data Fig. 2
Extended Data Fig. 2. CellNEST detects localized signaling in tumor and stromal environments in colorectal cancer tissue assayed with Visium HD.
CellNEST detects localized signaling in tumor and stromal environments in colorectal cancer tissue assayed with Visium HD (n = 24,068 cells). a, H& E image of colorectal cancer tissue with adenoma and invasive cancer regions outlined in black. b, CellNEST-detected component graph, where each component is shown with a distinct color and represents a disjoint network of CCC. Component 32 (black boundary) aligns with the invasive cancer region in a. c, Histogram showing the abundance of each CellNEST-detected CCC on the colorectal cancer tissue from a, where each communication is mapped to a particular component in b with a matching color. APP-ITGA6 and APP-TGFBR2 are more frequently found in component 32 (black boxes). d,e, Distribution of relay-network patterns along with their location detected by CellNEST on the tissue in a. d, The most abundant signals detected by CellNEST, with the signal C3-CXCR4 to C3-LRP1 highlighted in red. e, C3-CXCR4 to C3-LRP1 signals on the tissue. This relay pattern is commonly found in the tumor microenvironment region, recapitulated by CellNEST. The invasive cancer region from a is outlined in black.

References

    1. Hanahan, D. Hallmarks of cancer: new dimensions. Cancer Discov12, 31–46 (2022). - PubMed
    1. Armingol, E., Officer, A., Harismendy, O. & Lewis, N. E. Deciphering cell–cell interactions and communication from gene expression. Nat. Rev. Genet.22, 71–88 (2021). - PMC - PubMed
    1. Vento-Tormo, R. et al. Single-cell reconstruction of the early maternal-fetal interface in humans. Nature563, 347–353 (2018). - PMC - PubMed
    1. Wang, Y. et al. iTALK: an R package to characterize and illustrate intercellular communication. Preprint at bioRxiv10.1101/507871 (2019).
    1. Noël, F. et al. Dissection of intercellular communication using the transcriptome-based framework ICELLNET. Nat. Commun.12, 1089 (2021). - PMC - PubMed

MeSH terms

LinkOut - more resources