. 2025 Jun 6;25(1):204.
doi: 10.1186/s12935-025-03830-x.

TNS4 promotes lymph node metastasis of gastric cancer by interacting with integrin Β1 and inducing the activation of fibroblastic reticular cell

Affiliations

TNS4 promotes lymph node metastasis of gastric cancer by interacting with integrin Β1 and inducing the activation of fibroblastic reticular cell

Xiang Zhang et al. Cancer Cell Int. .

Abstract

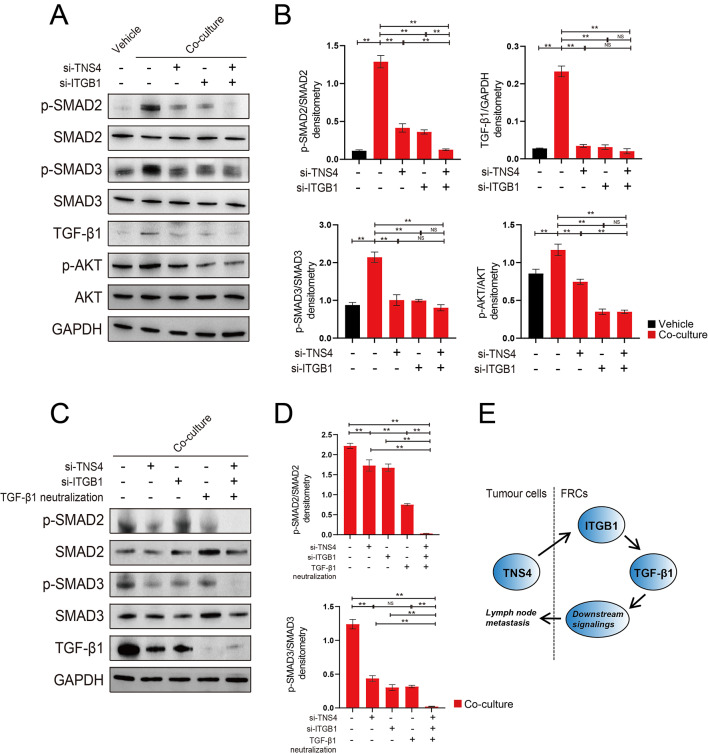
Lymph node (LN) metastasis of gastric cancer (GC) is one of the important pathways of GC metastasis, indicating the clinical staging and prognosis of patients. To investigate the underlying mechanism during the process of GC-induced LN metastasis, 7 pairs of GC tissues, paracancerous (PC) tissues, GC-positive LN (LN.P) and GC-negative LN (LN.N) tissues from GC patients with homogeneity were selected for RNA sequencing (RNA-seq) analysis. Tensin 4 (TNS4) was screened out and found to be significantly upregulated in LN.P tissues and closely related with the characteristics of GC. In vitro and in vivo experiments demonstrated that knockdown of TNS4 could significantly inhibit LN metastasis of GC cells and activation of fibroblastic reticular cells (FRCs) in LNs, thus inhibiting LN expansion induced by tumor cell invasion. Moreover, TNS4 was found to be interacted with integrin beta 1 (ITGB1) on FRCs, thereby affecting the binding of transforming growth factor β1 (TGF-β1) to ITGB1 and subsequently regulating downstream signaling molecules, and supporting the GC cell-induced LN metastasis.

Keywords: Fibroblastic reticular cells; Gastric cancer; Integrin beta 1; Lymph node metastasis; Tensin 4.


Conflict of interest statement

Declarations. Ethics approval and consent to participate: The study was approved by the Research Ethics Committee of Renji Hospital, School of Medicine, Shanghai Jiao Tong University. All participants in the study provided informed consent before specimens were collected. Approval letter of Shanghai Jiaotong University School of Medicine, Renji Hospital Ethics Committee is KY2024-046-C. The animal experiments were approved by the Renji Hospital Animal Ethics Committee (ID: 2024-066). Competing interests: The authors declare no competing interests.

Figures

Fig. 1
Fig. 1
TNS4 was up-regulated in GC tissues and especially had a high expression in tumor cells invaded LNs. (A). RNA-seq analysis of 7 pairs of clinical samples of GC, PC, LN.P and LN.N tissues; (B). The mRNA expression of TNS4 in GC, PC, LN.P and LN.N tissues; (C). The mRNA expression of TNS4 in 7 paired GC, PC, LN.P and LN.N tissues; (D and E). The protein expression of TNS4 in 3 paired GC, PC, LN.P and LN.N tissues (D). The statistical result of TNS4 expression in the 3 pairs of tissues is shown on the right (E); (F). IHC staining of TNS4 in GC-induced LN metastatic tissue microarray (containing 200 cases of GC - PC - metastatic/non-metastatic LN tissues). Scale Bar: 200 μm; (G). The expression changes of TNS4 in GC-induced metastatic/non-metastatic LN tissues. *P < 0.05;** P < 0.01;NS: no significance
Fig. 2
Fig. 2
Knockdown of TNS4 suppressed the LN metastasis of GC and decelerated the activation of FRCs and expansion of LNs. (A). Construction of a mouse foot pad LN metastasis model; (B). Validation of the interference efficiency of TNS4 in MFC cells; (C). The morphology of LN tissues from mice injected with TNS4 silenced and control MFC cells at 7 and 15 days respectively. Scale Bar: 1 mm; (D and E). Changes of LN tissue volume (D) and weight (E) between TNS4 silenced and control group at 7 and 15 days; (F). IF staining of TNS4 and pan-CK in LN tissues from mice of control group; (G and H). IHC staining of PCNA and TNS4 in LN tissues of TNS4 silenced and control group at 15 days (G). The statistical result of the number of PCNA-positive cells is shown on the right (H). Scale Bar: 200 μm; (I and J). IHC staining of a-SMA and Sirius Red staining in LN tissues of TNS4 silenced and control group at 15 days (I). The statistical results of the ratio of a-SMA and Sirius Red positive staining are shown on the right (J). Scale Bar: 200 μm; **P < 0.01
Fig. 3
Fig. 3
GC cells derived TNS4 promoted the activation of FRCs and invasion of tumor cells. (A). Experimental procedure for co-culturing mouse primary FRCs with TNS4 silenced and control MFC cells; (B). The activation status of FRCs under the conditions of FRCs alone, FRCs co-cultured with TNS4 silenced and control MFC cells (visible light). Scale Bar: 50 μm; (C). IF staining of a-SMA in FRCs alone, RCs co-cultured with TNS4 silenced and control MFC cells. Scale Bar: 25 μm; (D). The ratio of fully activated and partially activated FRCs under the conditions of FRCs alone, FRCs co-cultured with TNS4 silenced and control MFC cells (FRCs with an overall extension length > 50 μm are considered fully activated, and FRCs with an overall extension length < 50 μm are considered partially activated); (E and F). The changes of a-SMA (E) and Col1a1 (F) mRNA expression in FRCs alone, FRCs co-cultured with TNS4 silenced and control MFC cells respectively **P < 0.01
Fig. 4
Fig. 4
TNS4 directly interacted with ITGB1. (A). Prediction of TNS4 interacting proteins, including ITGB1; (B). The direct interaction between TNS4 and ITGB1 was analyzed by HDOCK; (C). Co-IP verification of the interaction between TNS4 and ITGB1; (D). IF staining of the co-localization of TNS4 and ITGB1 in mouse LN tissue (control group). Scale Bar: 50 μm; (E). IF staining of the co-localization of TNS4 in tumor cells and ITGB1 in FRCs (control group). Scale Bar: 100 μm; (F). IHC staining analysis of the correlation between TNS4 and ITGB1 in GC-induced LN metastatic tissue microarray. Scale Bar: 50 μm; (G). Heatmap of the correlation analysis of the staining intensity of TNS4 and ITGB1 on a GC-induced LN metastatic tissue microarray. Data were analysed by the chi-square test. (n = 163, P = 0.0274)
Fig. 5
Fig. 5
TNS4-ITGB1 regulated ITGB1 dependent TGF-β1-related signaling pathway. (A and B). Changes of signaling pathway molecules such as p-SMAD2, SMAD2, p-SMAD3, SMAD3, TGF-β1, p-AKT and AKT in FRCs alone and FRCs co-cultured with MFC cells respectively, with knockdown of TNS4 in MFC cells or knockdown of ITGB1 in FRCs (A). The results of the densitometry analyses are shown on the right (B). Data were presented as the means ± SD (n = 3); (C and D).Changes of p-SMAD2, SMAD2, p-SMAD3, SMAD3 and TGF-β1 in FRCs co-cultured with MFC cells, with knockdown of TNS4 in MFC cells or knockdown of ITGB1 in FRCs and administration of TGF-β1 neutralizing antibody (C). The results of the densitometry analyses are shown on the right (D). Data were presented as the means ± SD (n = 3); (E). Hypothesis on the interaction between TNS4 - ITGB1 - TGF-β1. *P < 0.05;** P < 0.01;NS: no significance
Fig. 6
Fig. 6
Blocking of TNS4-ITGB1 axis inhibits the metastasis of tumor cells and TGF-β1-related signaling. (A). The construction process of a mouse foot pad model using ITGB1 inhibitor in combination with TNS4 interference; (B). The morphological changes of LN tissues from mice in the control group, TNS4 silenced group, ITGB1 inhibitor-treated group and TNS4 shRNA/ITGB1 inhibitor treated group at 15 days. Scale Bar: 1 mm; (C and D). The changes of the volume (C) and weight (D) of LN tissues in the control group, TNS4 silenced group, ITGB1 inhibitor-treated group and TNS4 shRNA/ITGB1 inhibitor-treated group at 15 days; (E). IHC staining of PCNA in LN tissues of the control group, TNS4 silenced group, ITGB1 inhibitor-treated group and TNS4 shRNA/ITGB1 inhibitor-treated group at 15 days; (F and G). Changes of p-SMAD2, SMAD2, p-SMAD3, SMAD3, TGF - β1, p-AKT and AKT in LN tissues of the control group, TNS4 silenced group, ITGB1 inhibitor-treated group and TNS4 shRNA/ITGB1 inhibitor-treated group at 15 days. The results of the densitometry analyses are shown on the right (G). Data were presented as the means ± SD (n = 3); (H). TNS4 regulates the TGF-β1 signaling pathway by interacting with ITGB1, affecting the activation of FRCs in LNs and promoting LN metastasis of GC cells. * P < 0.05;**P < 0.01;NS: no significance

References

    1. Siegel RL, Miller KD, Jemal A. Cancer statistics, 2020. Ca-a Cancer J Clin. 2020;70:7–30. - PubMed
    1. Arnold M, Park JY, Camargo MC, et al. Is gastric cancer becoming a rare disease? A global assessment of predicted incidence trends to 2035. Gut. 2020;69:823–9. - PMC - PubMed
    1. Zeng YJ, Jin RU. Molecular pathogenesis, targeted therapies, and future perspectives for gastric cancer. Sem Cancer Biol. 2022;86:566–82. - PubMed
    1. Wang YY, Zhou YQ, Xie JX, et al. MAOA suppresses the growth of gastric cancer by interacting with NDRG1 and regulating the Warburg effect through the PI3K/AKT/mTOR pathway. Cell Oncol. 2023;46:1429–44. - PubMed
    1. Ni B, He X, Zhang YQ, et al. Tumor-associated macrophage-derived GDNF promotes gastric cancer liver metastasis via a GFRA1-modulated autophagy flux. Cell Oncol. 2023;46:315–30. - PMC - PubMed

LinkOut - more resources