Cropland restricts occurrence and alters spatial ecology near the mule deer geographical range limit
- PMID: 40481565
- PMCID: PMC12142936
- DOI: 10.1186/s40462-025-00566-1
Cropland restricts occurrence and alters spatial ecology near the mule deer geographical range limit
Abstract
Background: Habitat fragmentation can influence the spatial ecology of wildlife populations, with downstream effects on population dynamics and sustainability. Row-crop farming is a common anthropogenic landscape alteration, yet the effects on animal movement and space use is understudied in some species. Cropland can benefit wildlife nutritionally but may result in habitat loss because of changes in landscape composition and human disturbance.
Methods: We quantified the influence of cropland presence and coverage on mule deer spatial ecology in the southern Great Plains. We GPS-collared 146 adult mule deer in four regions of the Texas Panhandle and monitored movement relative to spatio-temporal fluctuations in cropland and particular crop species availability for 2 years. We modeled the effects of cropland on space use and resource selection at multiple spatio-temporal scales to characterize population and individual habitat components of mule deer.
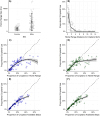
Results: We observed a functional response in cropland use, where at low coverage, use was proportional to availability but decreased with > 20% cropland coverage at the home range and within-home range scales. Few mule deer exhibited long-distance movements towards cropland. Individuals within 1.6 km of cropland exhibited greater cropland use, whereas deer > 4.2 km from cropland rarely used these areas. At the population level, mule deer selected cropland during the winter and late summer, probably for nutritional benefit when rangeland nutrients are low. At a finer scale, step-selection functions identified individual heterogeneity in crop species selection. Winter wheat, alfalfa, and fallow fields had greater use relative to other crop types. Generally, 15-60% of mule deer with access to cropland selected alfalfa year-round, and up to 63% of deer selected winter wheat post-reproduction.
Conclusions: Our results suggest that at a low spatial coverage, cropland alters the spatial ecology of mule deer at several spatio-temporal scales and may provide nutritional benefits, but at a cost of lost habitat when cropland exceeds 20% of the landscape. Declining groundwater resources and an exponentially growing human population will alter future farming practices. Understanding how species occupying these environments, such as mule deer, are influenced by human-induced landscape changes can enhance mitigation of human-wildlife interactions and aid conservation actions as policy and social pressures shape future agricultural practices.
Keywords: Odocoileus hemionus; Cropland; Functional response; Great plains; Ogallala aquifer; Resource selection; Row-crop farming; Step selection.
© 2025. The Author(s).
Conflict of interest statement
Declarations. Ethics approval and consent to participate: All animal capture and handling procedures were approved by the Institutional Animal Care and Use Committee at Texas A&M University-Kingsville protocol #2018-05-25 and were within guidelines established by the American Society of Mammalogists for research on wild mammals. We also complied with capture and handling procedures developed by the Texas Parks and Wildlife Department. Consent for publication: Not applicable. Competing interests: The authors declare no competing interests.
Figures


References
-
- Vitousek PM, Ehrlich PR, Ehrlich AH, Matson PA. Human appropriation of the products of photosynthesis. Bioscience. 1986;36:368–73. - DOI
-
- Fahrig L. Effects of habitat fragmentation on biodiversity. Annu Rev Ecol Evol Syst. 2003;34:487–515. - DOI
-
- Fischer J, Lindenmayer DB. Landscape modification and habitat fragmentation: a synthesis. Glob Ecol Biogeogr. 2007;16:265–80. - DOI
-
- Hansen AJ, Knight RL, Marzluff JM, Powell S, Brown K, Gude PH, et al. Effects of exurban development on biodiversity: patterns, mechanisms, and research needs. Ecol Appl. 2005;15:1893–905. - DOI
Grants and funding
LinkOut - more resources
Full Text Sources

