. 2025 Jun 6;24(1):164.
doi: 10.1186/s12943-025-02359-x.

Integrative multi-omics analysis reveals the LncRNA 60967.1-PLCD4-ATRA axis as a key regulator of colorectal cancer progression and immune response

Affiliations

Integrative multi-omics analysis reveals the LncRNA 60967.1-PLCD4-ATRA axis as a key regulator of colorectal cancer progression and immune response

Yiyi Chen et al. Mol Cancer. .

Abstract

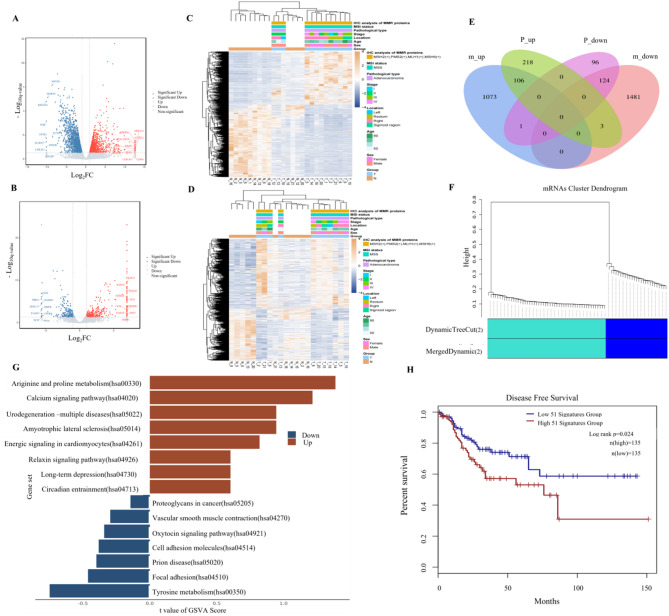
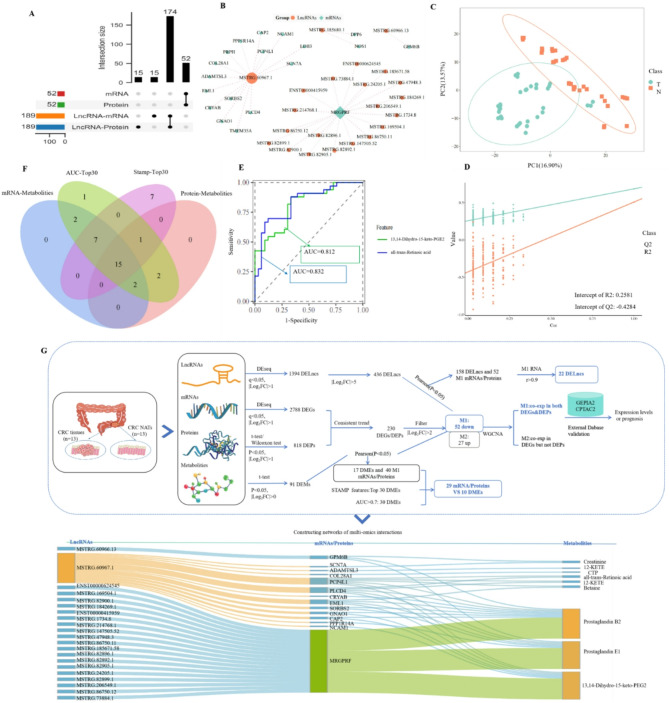
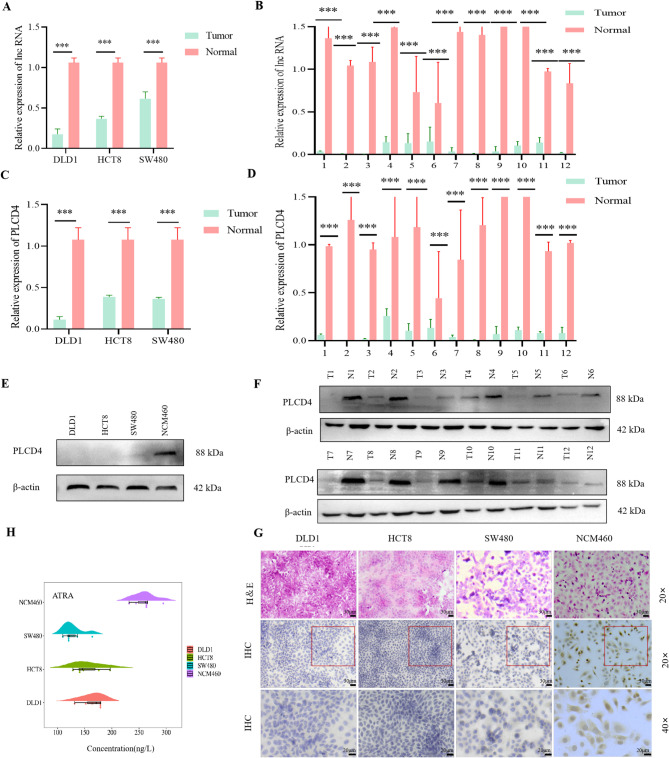
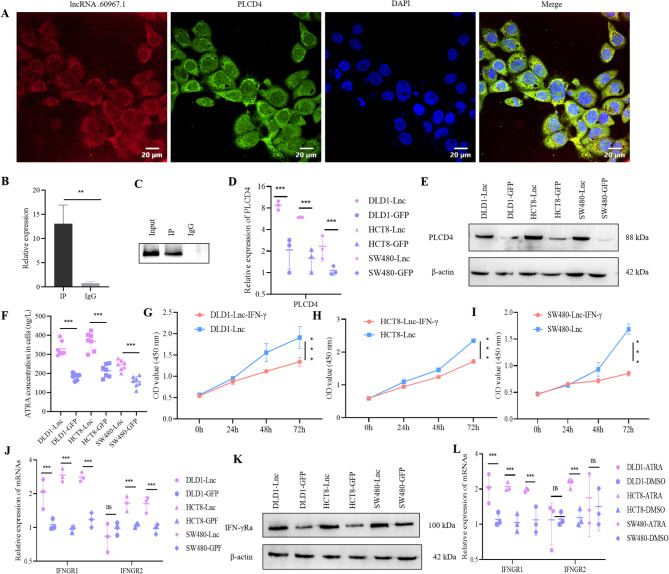
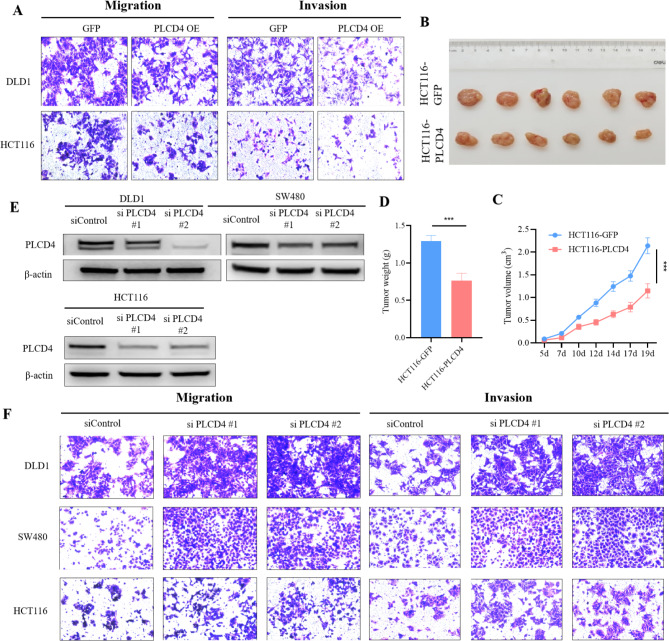
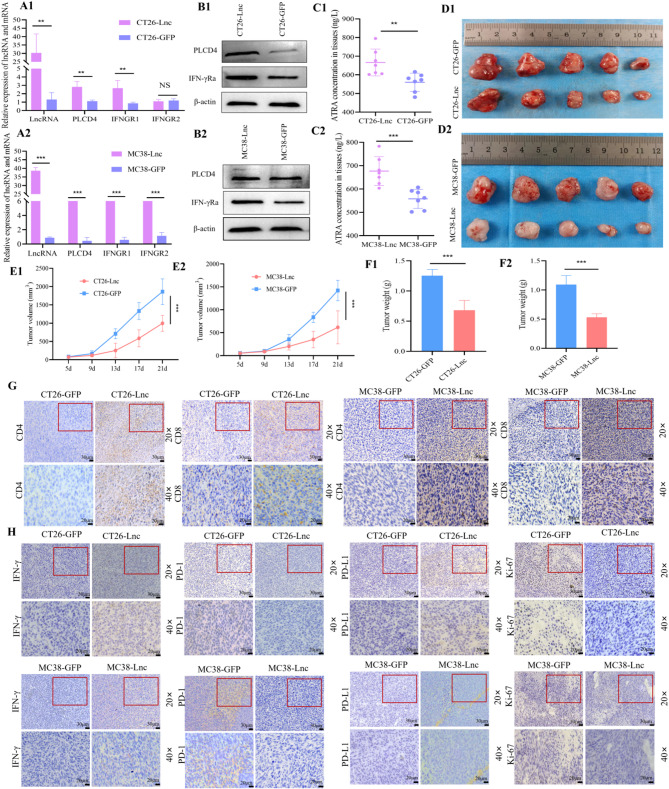
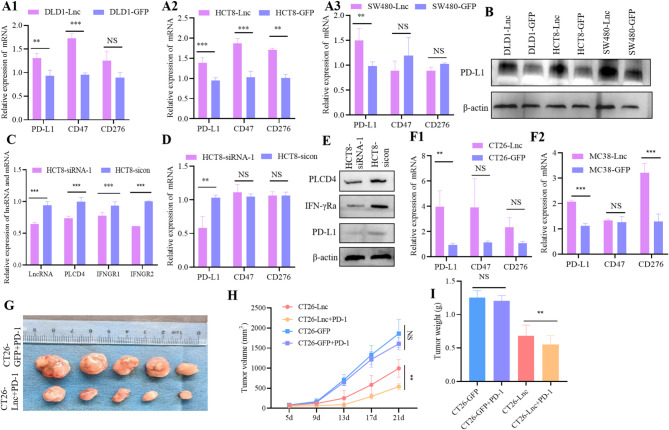
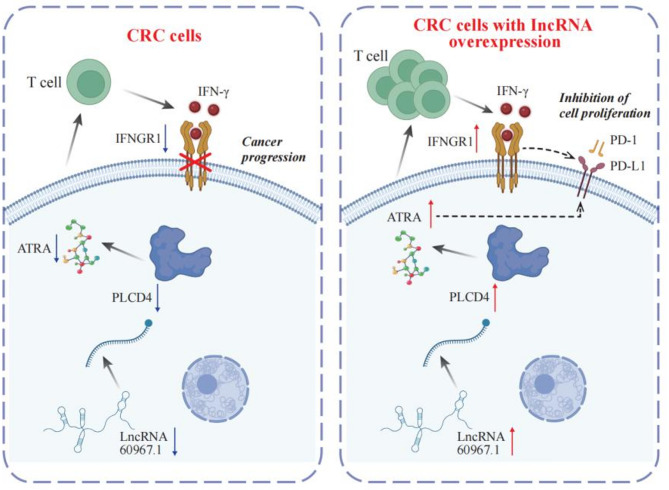
Colorectal cancer (CRC) is a major global health concern, characterized by high morbidity and mortality rates. CRC progression involves intricate molecular networks that remain incompletely understood. In this study, we conducted an integrative multi-omics analysis of transcriptomic, proteomic, and metabolomic profiles from CRC tissues and matched normal adjacent tissues (NATs). Our analysis revealed 1,394 differentially expressed long non-Coding RNAs (lncRNAs), 2,788 genes, 548 proteins, and 91 metabolites. A significant interaction network comprising 22 lncRNAs, 14 mRNAs/proteins, and 9 metabolites was identified, among which lncRNA 60967.1 emerged as a pivotal regulator. Functional validation demonstrated that lncRNA 60967.1 is markedly downregulated in CRC cell lines and patient tissues. Overexpression of lncRNA 60967.1 restored expression of the tumor suppressor PLCD4 and increased levels of all-trans retinoic acid (ATRA). This modulation enhanced IFN-γ-induced apoptosis and increased expression of the IFN-γ receptor subunit IFNGR1, thereby partially reversing IFN-γ resistance. In murine models, lncRNA 60967.1 overexpression promoted immune cell infiltration and synergized with anti-PD-1 therapy to inhibit tumor growth. Collectively, our findings uncover a novel lncRNA-mRNA/protein-metabolite network, the lncRNA 60967.1-PLCD4-ATRA axis, that plays a critical role in CRC progression and immune modulation, offering promising therapeutic targets for improved treatment efficacy.

Keywords: Colorectal cancer; Immunity; LncRNAs; Multi-omics; Tumor microenvironment.


Conflict of interest statement

Declarations. Ethics approval and consent to participate: The study received ethical approval from Sir Run Run Shaw Hospital, Hangzhou, China. All patients provided written informed consent. The Institutional Animal Care and Use Committee (IACUC) of the respective institutions approved all experiments. Consent for publication: All the authors have read and approved the final manuscript for publication. Competing interests: The authors declare no competing interests.

Figures

Fig. 1
Fig. 1
Identification of hub genes using WGCNA and validation against external databases. (A) Volcano plot of mRNA expression in 13 CRC tissues and paired NATs. (B) Volcano plot of protein expression in 11 CRC tissues and paired NATs. (C) Hierarchical heatmap of DEGs in 13 CRC tissues and paired NATs. (D) Hierarchical heatmap of DEPs in 11 CRC tissues and paired NATs. (E) Venn diagram illustrating the overlap between mRNAs and proteins with consistent expression patterns. (F) WGCNA co-expression module analysis of mRNAs. (G) GSEA of 52 hub genes in the turquoise module. (H) Survival analysis of the gene set in the turquoise module. Abbreviations: DEGs, differentially expressed genes; DEPs, differentially expressed proteins; WGCNA, weighted gene co-expression network analysis; GSEA, gene set enrichment analysis
Fig. 2
Fig. 2
Integrated multi-omics analysis reveals network associations among lncRNAs, mRNAs, proteins, and metabolites. (A) Upset plot of lncRNAs showing statistically significant associations with mRNAs and proteins. (B) Network diagram depicting lncRNA interactions with target genes. (C) PLS-DA analysis of metabolomic data. (D) Evaluation of the PLS-DA model for metabolomic data, including model performance metrics and the separation of sample groups. (E) ROC analysis identifying two metabolites with AUC > 0.8. (F) Venn diagram illustrating the overlap among mRNA–metabolite pairs, protein–metabolite pairs, the top 30 AUC metabolites, and the top 30 STAMP metabolites. (G) Bioinformatic analysis reveals predicted associations among lncRNAs, mRNAs/proteins, and metabolites. Top: data analysis pipeline; Bottom: network of lncRNAs, mRNAs/proteins, and metabolites. Abbreviations: ROC, receiver operating characteristic; AUC, area under the curve; PLS-DA, partial least squares discriminant analysis; STAMP, statistical analysis of taxonomic and functional profiles
Fig. 3
Fig. 3
Experimental validation of mRNA, lncRNA, and metabolite levels. (A) Expression of lncRNA 60967.1 in CRC cell lines (DLD1, HCT8, SW480) relative to the normal colon cell line (NCM460), measured by qRT-PCR. (B) qRT-PCR validation of lncRNA 60967.1 expression in 12 paired CRC tumor and normal tissues. (C) qRT-PCR analysis of PLCD4 mRNA levels in the three CRC cell lines (DLD1, HCT8, SW480) and the normal colon cell line. (D) qRT-PCR validation of PLCD4 mRNA levels in 12 paired CRC tumor and normal tissues. (E-F) Western blot analysis of PLCD4 protein expression in the three CRC cell lines (DLD1, HCT8, SW480) and the normal colon cell line (NCM460) (E) and 12 paired tumor (T#) and normal (N#) tissues (F). (G) IHC analysis of PLCD4 protein expression in the three CRC cell lines (DLD1, HCT8, SW480) and the normal colon cell line (NCM460). (H) ELISA-based quantification of ATRA levels in culture supernatants from the three CRC cell lines (DLD1, HCT8, SW480) and the normal colon cell line (NCM460). ***P < 0.01 (t test)
Fig. 4
Fig. 4
Molecular and functional effects of lncRNA 60967.1 on PLCD4 expression, ATRA levels, and CRC cell proliferation. (A) Fluorescence in situ hybridization (FISH) showing the localization of lncRNA 60967.1 and PLCD4 mRNA in NCM460 cells. (B) RIP assay followed by qRT-PCR analysis of lncRNA 60967.1 in immunoprecipitated (IP) and IgG control groups. (C) RIP assay followed by Western blot analysis of PLCD4 in the input, immunoprecipitated (IP), and IgG control groups. (D) qRT-PCR analysis of PLCD4 mRNA in CRC cells (DLD1, HCT8, SW480) transfected with GFP control or lncRNA 60967.1 vector. (E) Western blot analysis of PLCD4 protein expression in CRC cells (DLD1, HCT8, SW480) with GFP or lncRNA 60967.1 vector. (F) ELISA measurement of ATRA levels in CRC cells (DLD1, HCT8, SW480) with GFP or lncRNA 60967.1 vector. (G-I) CCK-8 assay for CRC cell proliferation (DLD1, HCT8, SW480) transfected with lncRNA 60967.1 vector, followed by IFN-γ stimulation. (J) qRT-PCR analysis of IFNGR1/IFNGR2 mRNA in CRC cells transfected with GFP or lncRNA 60967.1 vector. (K) Western blot analysis of IFN-γRa protein in CRC cells (DLD1, HCT8, and SW480) transfected with GFP or lncRNA 60967.1 vector. (L) qRT-PCR evaluation of IFNGR1/IFNGR2 mRNA in CRC cells (DLD1, HCT8, and SW480) stimulated by ATRA or DMSO. Abbreviation: CCK-8, Cell Counting Kit-8. NS: not significant (t-test); **P < 0.05, ***P < 0.01 (t-test)
Fig. 5
Fig. 5
PLCD4 acts as a tumor suppressor in CRC. (A) Migration and invasion assays using two CRC cell lines (HCT116 and DLD1) transfected with either GFP (NC) or PLCD4 expression (PLCD4 OE) vectors. (B) Tumors from Balb/c nude mice injected with HCT116 cells transduced with either GFP (Top) or PLCD4 (Bottom) expression vectors. (C) Tumor growth over time in Balb/c nude mice injected with HCT116 cells transduced with GFP (blue) or PLCD4 (pink) expression vectors. (D) Measurement of tumor weight in Balb/c nude mice injected with HCT116 cells transduced with GFP (blue) or PLCD4 (pink) expression vectors. (E) Western blot analysis of PLCD4 expression in CRC cell lines (DLD1, SW480, HCT116) following siRNA-mediated knockdown (siPLCD4#1 or siPLCD4#2) or non-targeting control siRNA (siControl). (F) Migration and invasion assays using CRC cell lines (DLD1, SW480, HCT116) transfected with two PLCD4-targeting siRNAs (siPLCD4#1 or siPLCD4#2) or non-targeting control siRNA (siControl)
Fig. 6
Fig. 6
LncRNA 60967.1 overexpression promotes PLCD4 and ATRA expression, enhances immune cell infiltration, and reduces tumor growth in mouse CRC models. (A1–A2) qRT-PCR analysis of lncRNA 60967.1, PLCD4, and IFNGR1/2 expression in tumor tissues from mice injected with mouse CRC cells (CT26, A1; MC38, A2) transfected with lncRNA 60967.1 or GFP vectors. (B1–B2) Western blot analysis of PLCD4 and IFN-γRα proteins in tumor tissues from mice injected with CT26 cells (B1) or MC38 cells (B2) transfected with lncRNA 60967.1 or GFP vectors. (C1–C2) ELISA analysis of ATRA in tumor tissues from mice injected with CT26 cells (C1) or MC38 cells (C2) transfected with lncRNA 60967.1 or GFP vectors. (D1–D2) Tumors harvested from Balb/c mice that were subcutaneously injected with either CT26 cells (D1) or MC38 cells (D2). Each cell line was transfected with GFP or lncRNA 60967.1 vectors prior to injection, allowing comparison of tumor growth and size between the control and experimental groups. (E1–E2) Tumor growth curves in Balb/c mice injected with CT26 cells (E1) or MC38 cells (E2) transfected with either GFP or lncRNA 60967.1 vectors. Tumor sizes were measured at regular intervals to compare progression between the control (GFP) and lncRNA 60967.1 overexpression groups. (F1–F2) Measurement of tumor weight in Balb/c nude mice injected with CT26 cells (F1) or MC38 cells (F2), transfected with either GFP or lncRNA 60967.1 expression vectors. (G) IHC analysis of CD4 and CD8 expression in tumor tissues from Balb/c mice subcutaneously injected with either CT26 or MC38 cells. Each cell line was transfected with GFP or lncRNA 60967.1 vectors before injection, enabling a comparison of immune cell infiltration between control and lncRNA 60967.1-overexpressing groups. (H) IHC analysis of IFN-γ, PD-1, PD-L1, and Ki67 expression in tumor tissues from Balb/c mice subcutaneously injected with either CT26 or MC38 cells. Each cell line was transfected with GFP or lncRNA 60967.1 vectors before injection, allowing for a comparison of the functional states or activation/exhaustion profiles of immune cells between the control and lncRNA 60967.1-overexpressing groups. NS indicates no significant difference (t-test); **P < 0.05, ***P < 0.01 (t-test)
Fig. 7
Fig. 7
LncRNA 60967.1 upregulates immune checkpoint gene expression and enhances anti–PD-1 efficacy in CRC mouse models. (A1-A3) qRT-PCR analysis of PD-L1, CD47, and CD276 mRNA levels in three CRC cell lines (DLD1, A1; HCT8, A2; and SW480, A3) transfected with either a GFP control or an lncRNA 60967.1 expression vector. (B) Western blot analysis of PD-L1 levels in DLD1, HCT8, and SW480 cells transfected with either a GFP control or a lncRNA 60967.1 expression vector. (C) qRT-PCR analysis of lncRNA 60967.1, PLCD4, IFNGR1, and IFNGR2 expression in HCT8 cells transfected with an siRNA vector targeting lncRNA 60967.1 (HCT8-siRNA-1) or a non-targeting control vector (HCT8-NC). (D) qRT-PCR validation of PD-L1, CD47, and CD276 mRNA expression in HCT8 cells transfected with siRNA targeting lncRNA 60967.1 (HCT8-siRNA-1) or a non-targeting control (HCT8-NC). (E) Western blot analysis of PD-L1 expression in HCT8 cells transfected with siRNA targeting lncRNA 60967.1 (HCT8-siRNA-1) or a non-targeting control (HCT8-NC). (F1–F2) qRT-PCR measurement of immune checkpoint gene mRNA levels (PD-L1, CD47, and CD276) in tumor tissues from Balb/c mice injected with CT26 cells (F1) or MC38 cells (F2). Cell lines were transfected with GFP (control) or lncRNA 60967.1 vectors before injection to compare checkpoint gene expression. (G) Tumors harvested from Balb/c mice that were subcutaneously injected with CT26 cells transfected with either GFP (Top) or lncRNA 60967.1 vectors (Bottom), followed by intraperitoneal administration of anti–PD-1 monoclonal antibody. (H) Tumor growth over time in Balb/c nude mice injected with CT26 cells transfected with either GFP or lncRNA 60967.1 vectors, followed by intraperitoneal administration of anti-PD-1 monoclonal antibody. (I) Tumor weight in Balb/c nude mice injected with CT26 cells transfected with either GFP or lncRNA 60967.1 vectors, followed by intraperitoneal administration of anti-PD-1 monoclonal antibody. NS indicates no significant difference (t-test); **P < 0.05, ***P < 0.01 (t-test)
Fig. 8
Fig. 8
A proposed model suggests that lncRNA 60967.1 plays a regulatory role in modulating the PLCD4/ATRA axis and anti-PD-1 therapy, influencing immune responses and affecting CRC progression

Similar articles

References

    1. Morgan E, Arnold M, Gini A, Lorenzoni V, Cabasag CJ, Laversanne M, Vignat J, Ferlay J, Murphy N, Bray F. Global burden of colorectal cancer in 2020 and 2040: incidence and mortality estimates from GLOBOCAN. Gut. 2023;72(2):338–44. - PubMed
    1. Siegel RL, Wagle NS, Cercek A, Smith RA, Jemal A. Colorectal cancer statistics, 2023. CA Cancer J Clin. 2023;73(3):233–54. - PubMed
    1. Cancer Genome Atlas N. Comprehensive molecular characterization of human colon and rectal cancer. Nature. 2012;487(7407):330–7. - PMC - PubMed
    1. Shin AE, Giancotti FG, Rustgi AK. Metastatic colorectal cancer: mechanisms and emerging therapeutics. Trends Pharmacol Sci. 2023;44(4):222–36. - PMC - PubMed
    1. Siegel RL, Miller KD, Goding Sauer A, Fedewa SA, Butterly LF, Anderson JC, Cercek A, Smith RA, Jemal A. Colorectal cancer statistics, 2020. CA Cancer J Clin. 2020;70(3):145–64. - PubMed

MeSH terms