. 2025 Jun 6;58(1):34.
doi: 10.1186/s40659-025-00615-4.

Knockout of bcas3 gene causes neurodevelopment defects in zebrafish

Affiliations

Knockout of bcas3 gene causes neurodevelopment defects in zebrafish

Huihui Liu et al. Biol Res. .

Abstract

Background: Neurodevelopmental disorders manifest in early childhood and are characterized by cognitive deficits, intellectual disabilities, motor disorders, and social dysfunction. Mutations in BCAS3 gene are associated with syndromic neurodevelopmental disorders in humans, while the detailed pathological mechanism is still unknown.

Methods: CRISPR/Cas9 technology was used to generate a bcas3 knockout zebrafish model. To investigate the effects of bcas3 on development, morphological evaluations were conducted. Locomotor behaviors, including performance in the light-dark test, novel tank test, mirror test, shoaling test, and social test, were assessed through video tracing and quantitative analysis of movement parameters. Transcriptome sequencing analysis was used to identify dysregulated pathways associated with development process. Additionally, Acridine Orange staining was employed to evaluate apoptosis. Western blot and real-time RT-PCR were used to analyze the expression levels of genes.

Results: Bcas3 knockout zebrafish exhibited early larval phenotypes resembling clinical features of patients with BCAS3 mutations, including global delayed development at early embryonic development, microcephaly and reduced body length. Behavior analysis revealed abnormal motor dysfunction, such as social impairment, increased anxiety and heightened aggression. Notably, human BCAS3 rescued the developmental defects and motor disorders in bcas3 knockout larvae. Transcriptomic analysis identified substantial downregulation of genes related to embryonic development and startle response, brain development and neuron migration in bcas3 knockout zebrafish, such as rpl10, cyfip2, erbb3b, eya4a, nr2f1b, prkg1b and ackr3b. Additionally, increased apoptosis was observed in bcas3 knockout zebrafish, which was further confirmed by Acridine Orange staining and a decreased Bcl2/Bax ratio in western blot analysis. The increased apoptosis observed in the brain of bcas3 knockout larvae could contribute to the developmental and locomotor deficits.

Conclusion: The bcas3 knockout zebrafish model recapitulates the clinical features observed in patients with BCAS3 mutations. Our results suggest that increased apoptosis may underlie the developmental deficits and motor disorders in these patients. The bcas3 knockout zebrafish model provides a valuable tool to identify dysregulated molecular targets for therapeutic intervention during the early stages of disease progression.

Supplementary Information: The online version contains supplementary material available at 10.1186/s40659-025-00615-4.

Keywords: BCAS3; CRISPR/Cas9; Neurodevelopmental disorder; Zebrafish.


Conflict of interest statement

Declarations. Competing interests: The authors declare no competing interests.

Figures

Fig. 1
Fig. 1
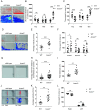
Construction of bcas3 KO zebrafish by CRISPR/Cas9 technology. (A), Whole-mount in situ hybridization (WISH) for bcas3 mRNA in WT zebrafish embryos at different development stages. Scale bars: 200 μm. (n = 20 embryos per group). WT: wild type. (B), Temporal pattern of mRNA expression of zebrafish bcas3 gene at different stages. mRNA extracts from whole-embryos were analyzed by RT-PCR for bcas3 mRNA levels at different zebrafish embryo stages. (n = 20 embryos per group). (C), Schematic diagram shows the genomic structure of zebrafish bcas3 with all 24 exons and the site of genome editing marked. The gene editing target site is located in the 12th exon of bcas3 gene. Target sequences are underlined. PAM sequences are highlighted in red. (D), DNA sequence analysis identified the bcas3−/− insertion mutant zebrafish line with a 22 bp insertion in exon 12 of bcas3 gene. (E), The 22 bp insertion in bcas3 causes frame-shift and is predicted to cause a premature stop codon, resulting in a truncated mutant bcas3 proteins with only 302 amino acids left. (F-G), Real-time RT-PCR analysis showed that the bcas3 mRNA level in 10 hpf (hours post fertilization) embryos and brains of 4 mpf (months post fertilization) bcas3−/− zebrafish was reduced compared to WT controls. (n = 3, per group). The rpl13a gene was used as endogenous control. Data are shown as mean ± SEM. Unpaired Student’s t-test was used to analyze RT-qPCR. Significance levels are denoted as follows: **P < 0.01, ***P < 0.001
Fig. 2
Fig. 2
Bcas3 KO in zebrafish results in developmental deficiency. (A), Time-matched bright field images of WT and bcas3−/− embryos during early development. Scale bars: 200 μm. (n = 15, per group). (B-C), Microcephaly index (the interocular distances/body length) comparison of 5 dpf (days post fertilization) WT and bcas3−/− larvae. Representative images (B) and quantitative analysis (C) of the interocular distances/body length in 5 dpf WT (n = 37) and bcas3−/− larvae (n = 41). Scale bars: 500 μm. (D-E), Body length comparison of 5 dpf WT and bcas3−/− larvae. Representative images (D) and quantitative analysis of body lengths (E) in 5 dpf WT (n = 37) and bcas3−/− larvae (n = 41). Scale bars: 200 μm. (F-G), Body length comparison of 4 mpf WT and bcas3−/− larvae. Representative images (F) and quantitative analysis of body lengths (G) in 4 mpf zebrafish. Scale bars: 200 μm. (n = 5, per group). (H), Representative images of the brain of 4 mpf zebrafish. (I), The ratio of brain/body weight of WT and bcas3−/− zebrafish at 4 months. (n = 5, per group). Data are shown as mean ± SEM. Unpaired Student’s t-test was used to analyze interocular distances, body length, and the ratio of brain/body weight. Significance levels are denoted as follows: *P < 0.05, ***P < 0.001
Fig. 3
Fig. 3
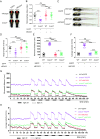
The locomotor activity of bcas3 KO zebrafish larvae. (A), The SPC frequence of 24 hpf zebrafish. SPC, spontaneous curls. (n = 10, per group). (B-D), The basic movement of zebrafish under light condition. (B), Representative image of trajectory and heat map. Quantitative analysis of distance (C) and average velocity (D) in 6 dpf WT and bcas3−/− larvae. (n = 22, per group). (E), Graph illustrating the movement distance of 6 dpf zebrafish to alternating light-dark conditions, with periods consisting of 5-minute darkness and 5-minute light. The plot graph represents the movement distance of WT and bcas3−/− larvae per minute. (n = 23, per group). (F), The average velocity of 6 dpf zebrafish during light-dark conditions with periods consisting of 55-minute darkness and 5-minute light. The plot graph represents the average velocity of WT and bcas3−/− larvae per minute. (n = 23, per group). Data are shown as mean ± SEM. Unpaired Student’s t-test was used to analyze the SPC frequence, distance and average velocity. Significance levels are denoted as follows: ***P < 0.001
Fig. 4
Fig. 4
Adult bcas3 KO zebrafish showed increased anxiety, aggression and abnormal social. (A-C), Analysis of the behavior of 4 mpf WT and bcas3−/− zebrafish in novel tank test. (A), Representative trajectory and heatmap image. Quantitative analysis of distance (B) and time (C) spent in bottom, middle, and top zones. (n = 17, per group). Bcas3 KO zebrafish exhibited reduced distance and movement time spent in the top zone compared to WT controls, indicating increased anxiety-like behavior. The tank was divided horizontally into three equal sections: the top zone, the middle zone, and the bottom zone. (D-F), Analysis of 4 mpf WT and bcas3−/− zebrafish behavior in mirror biting test. (D), Representative trajectory and heatmap image. Quantitative analysis of average velocity (E) and active time spent in contact zone (the distance from the mirror < 2 cm), approach zone (2 cm ≤ the distance from the mirror ≤ 6 cm), and far zone (the distance from the mirror > 6 cm) (F) in WT and bcas3−/− zebrafish. ①, contact. ②, approach. ③, far. (n = 17 per group). Bcas3 KO zebrafish spent more time in the contact zone, indicating heightened aggressive behavior. (G-H), Analysis of 4 mpf WT and bcas3−/− zebrafish behavior in shoaling behavior test. Representative image (G) and average inter-fish distance (H) was significantly increased in bcas3−/− zebrafish, indicating reduced social cohesion. (n = 30, per group). (I-L), Analysis of 4 mpf WT and bcas3−/− zebrafish behavior in social test. (J), Representative trajectory and heatmap image. Quantitative analysis of total movement distance (I), average velocity (K) and time spent in left and right regions (L) in WT and bcas3−/− zebrafish. (n = 11, per group). Data are shown as mean ± SEM. Unpaired Student’s t-test was used to analyze movement distance, average velocity and active time spent in different zones. Significance levels are denoted as follows: *P < 0.05, **P < 0.01, ***P < 0.001. ns, not significant
Fig. 5
Fig. 5
Human BCAS3 gene rescued the developmental deficiency and locomotor defects of bcas3 KO larvae. (A-B), Microcephaly index (the interocular distances/body length) comparison of 5 dpf WT and bcas3−/− larvae injected with EGFP or EGFP-hBCAS3. Representative images (A) and quantitative analysis of the interocular distances/body length in 5 dpf larvae, (n = 23, per group). hBCAS3, human BCAS3. (C-D), Body length comparison of 5 dpf WT and bcas3−/− larvae injected with EGFP or hBCAS3. Representative images (C) and quantitative analysis of body lengths (D) in 5 dpf larvae. WT + EGFP (n = 20), bcas3−/− + EGFP (n = 20), WT + EGFP-hBCAS3 (n = 22), bcas3−/− + EGFP-hBCAS3 (n = 22). Scale bars: 500 μm. (E-F), The basic movement of zebrafish, injected with EGFP or EGFP-hBCAS3, under light condition. Quantitative analysis of distance (E) and average velocity (F) in 6 dpf WT and bcas3−/− larvae. (n = 24, per group). (G), Graph illustrating the movement distance of 6 dpf zebrafish, injected with EGFP or EGFP-hBCAS3, to alternating light-dark conditions, with periods consisting of 5-minute darkness and 5-minute light. The plot graph represents the movement distance of larvae per minute. WT + EGFP (n = 24), bcas3−/− + EGFP (n = 24), WT + EGFP-hBCAS3 (n = 23), bcas3−/− + EGFP-hBCAS3 (n = 22). (H), Graph illustrating the average velocity of 6 dpf zebrafish, injected with EGFP or EGFP-hBCAS3, to alternating light-dark conditions, with periods consisting of 5-minute darkness and 5-minute light. The plot graph represents the average velocity of larvae per minute. WT + EGFP (n = 24), bcas3−/− + EGFP (n = 24), WT + EGFP-hBCAS3 (n = 23), bcas3−/− + EGFP-hBCAS3 (n = 22). Data are shown as mean ± SEM. One-way ANOVA was used to analyze interocular distances, body length, movement distance and average velocity. Significance levels are denoted as follows: ***P < 0.001. ns, not significant
Fig. 6
Fig. 6
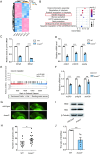
Transcriptomic profiling analysis of bcas3 KO zebrafish larvae. (A), Hierarchical clustering heat map of 920 upregulated and 998 downregulated genes from 3dpf bcas3−/− larvae comparison to WT controls (n = 30, per group). Color intensity indicating fold changes. Upregulation and downregulation are marked in pink and blue, respectively. WT: wild-type larvae; mut: bcas3−/− larvae. (B), ClueGO pathway analysis. (C), Real-time RT-PCR analysis showed that the rpl10 mRNAlevel in 24 hpf embryos and 36 hpf embryos from bcas3−/− zebrafish was reduced compared to WT controls. (n = 3, per group). The rpl13a gene was used as endogenous control. (D), Real-time RT-PCR analysis for cyfip2, erbb3b and eya4 mRNA in 36 hpf zebrafish. (n = 3, per group). The rpl13a gene was used as endogenous control. (E), GESA analysis revealed that bcas3 KO affected expression of genes involved in neuron migration. GESA, gene set enrichment analysis. (F), Real-time RT-PCR analysis for nr2f1b, prkg1b and ackr3b mRNA in 3 dpf zebrafish. (n = 3, per group). The rpl13a gene was used as endogenous control. (G-H), 36 hpf WT and bcas3−/− larvae were stained with acridine orange (AO) to label apoptosis cells in vivo. Representative images (G) of AO staining in the larvae brains as indicated. Scale bars: 200 μm. (H), Quantitative analysis of apoptotic cells in the brain areas of the WT (n = 16) and bcas3−/− larvae (n = 17). (I-J), Western-blot analysis for apoptosis- relative protein Bcl2 and Bax in 3 dpf zebrafish. (n = 5, per group). β-Tubulin was used as endogenous control. Data are shown as mean ± SEM. Unpaired Student’s t-test was used to analyze RT-qPCR, AO staining, and western blot. Significance levels are denoted as follows: *P < 0.05, **P < 0.01, ***P < 0.001. ns, not significant

Similar articles

References

    1. Lewerissa EI, Nadif Kasri N, Linda K. Epigenetic regulation of autophagy-related genes: implications for neurodevelopmental disorders. Autophagy. 2024;20(1):15–28. - PMC - PubMed
    1. Thapar A, Cooper M, Rutter M. Neurodevelopmental disorders. Lancet Psychiatry. 2017;4(4):339–46. - PubMed
    1. Lukens JR, Eyo UB. Microglia and neurodevelopmental disorders. Annu Rev Neurosci. 2022;45:425–45. - PMC - PubMed
    1. Stamberger H, Nikanorova M, Willemsen MH, Accorsi P, Angriman M, Baier H, Benkel-Herrenbrueck I, Benoit V, Budetta M, Caliebe A, Cantalupo G, Capovilla G, Casara G, Courage C, Deprez M, Destrée A, Dilena R, Erasmus CE, Fannemel M, Fjær R, Giordano L, Helbig KL, Heyne HO, Klepper J, Kluger GJ, Lederer D, Lodi M, Maier O, Merkenschlager A, Michelberger N, Minetti C, Muhle H, Phalin J, Ramsey K, Romeo A, Schallner J, Schanze I, Shinawi M, Sleegers K, Sterbova K, Syrbe S, Traverso M, Tzschach A, Uldall P, Van Coster R, Verhelst H, Viri M, Winter S, Wolff M, Zenker M, Zoccante L, De Jonghe P, Helbig I, Striano P, Lemke JR, Møller RS, S., Weckhuysen. STXBP1 encephalopathy: A neurodevelopmental disorder including epilepsy. Neurology 2016;86(10): 954– 62. - PubMed
    1. Raine A. Antisocial personality as a neurodevelopmental disorder. Annu Rev Clin Psychol. 2018;14:259–89. - PubMed

LinkOut - more resources