. 2025 Jul 15;6(7):102161.
doi: 10.1016/j.xcrm.2025.102161. Epub 2025 Jun 6.

Extracellular vesicle heterogeneity through the lens of multiomics

Affiliations

Extracellular vesicle heterogeneity through the lens of multiomics

Taylon F Silva et al. Cell Rep Med. .

Abstract

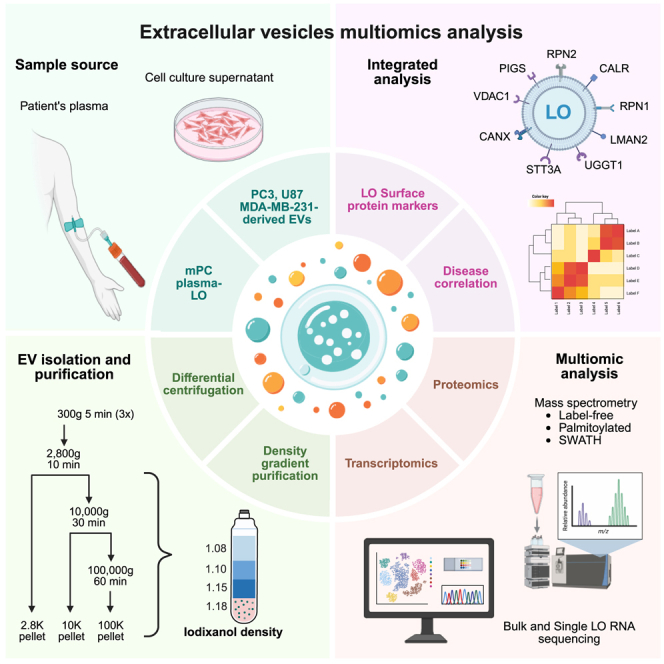
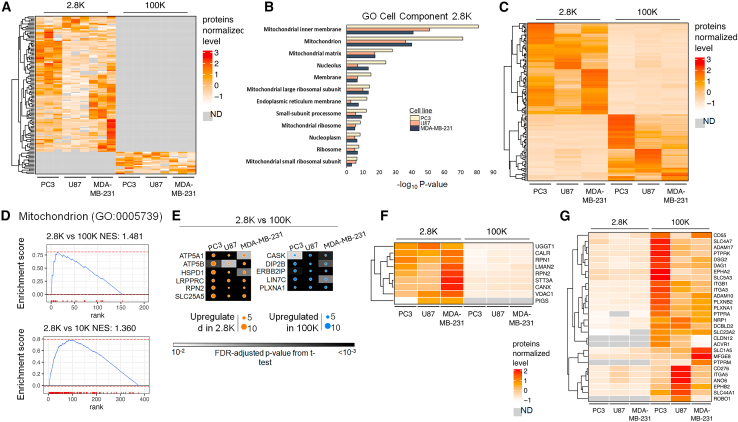
Extracellular vesicles (EVs) are heterogeneous in size, biogenesis, content, and function. Aggressive cancer cells release a distinct, poorly characterized, and particularly large EV subtype, namely large oncosomes (LOs). This study employs an optimized method to improve LO yields and integrates mass spectrometry and RNA sequencing (RNA-seq) to profile their molecular cargo. A consistent set of proteins enriched in LOs is identified across glioma, prostate, and breast cancer cell lines. These proteins are also present as mRNA in LOs from the prostate cancer model and are abundant in plasma LOs from 20 patients with metastasis. Single-LO RNA-seq confirms bulk LO cargo, demonstrating the utility of single-cell technologies for large vesicle analysis. Our patient study provides proof-of-principle evidence that we can use multiomics to delve into EV heterogeneity, biogenesis, and composition. It also suggests that plasma LOs help stratify patients, supporting their potential prognostic value for developing a multi-analyte approach for liquid biopsy.

Keywords: cancer; extracellular vesicles; large oncosomes; liquid biopsy; multiomics; prostate cancer; proteomic; single-vesicle RNA-seq; transcriptomic.


Conflict of interest statement

Declaration of interests P.C.B. sits on the Scientific Advisory Board of Intersect Diagnostics Inc. and previously sat on those of BioSymetrics Inc. and Sage Bionetworks.

Figures

None
Graphical abstract
Figure 1
Figure 1
Large oncosome cargo is more evident in the low-speed than in the medium-speed fraction (A) Divisive hierarchical clustering (DIANA) of the normalized relative abundance of the proteins identified across the indicated EV populations and cell lines. Pearson’s correlation was used to calculate the correlation matrix. (B) The three EV fractions and the whole-cell lysate (WCL) from PC3 cells were blotted with the indicated antibodies to characterize the presence of standard EV proteins in the different preps according to the minimal information for studies of extracellular vesicles (MISEV) recommendations. (C) Normalized relative abundance and fold change of the large EV (HSDP1 and HSPA5)- and small EV (CD9 and ITGB1)-enriched proteins across the indicated EV pellets and cell lines. (D) The gene set enrichment analysis (GSEA) of the proteins differentially enriched in large oncosomes (FC > 1, FDR < 0.05) across different EV populations from PC3 cell line. See also Figure S3.
Figure 2
Figure 2
The low- and high-speed fractions contain the two most distinct L-EV and S-EV populations (A) Heatmap showing normalized protein intensity of the proteins unique to the low- or high-speed EV fractions from the indicated cell lines. ND, not detected. (B) Gene Ontology (GO) analysis of the proteins unique to the low-speed fraction of all cancer cell types demonstrates a robust representation of the cell component term mitochondria in L-EVs. (C) Heatmap and dendrogram of differentially abundant proteins in L-EVs and S-EVs. ND, not detected. (D) GSEA of the differentially abundant proteins using the term Mitochondrion (GO:0005739) showing that mitochondrial proteins are enriched in L-EVs. (E) The most enriched (top 25%, fold change > upper quartile) and most highly expressed (top 25%, normalized expression > upper quartile) differentially abundant proteins in L-EVs and S-EVs common to all three cell lines. (F and G). Surface proteins unique to or differentially abundant in either L-EVs (F) or S-EVs (G) and common to the PC3, U87, and MDA-MB-231 cell lines. ND, not detected. See also Figure S3. See also Figure S4.
Figure 3
Figure 3
L-EV markers might be prognostic and predictive of treatment outcomes in metastatic prostate cancer patients (A) Heatmap of the highly abundant surface proteins differentially expressed in either L-EVs or S-EVs identified in all three cell lines described in Figures 2F and 2G present in the LOs of metastatic PC patients. (B) Agglomerative hierarchical clustering analysis using the Euclidean distance and Ward’s linkage of the proteins differentially expressed (p value < 0.05) in plasma L-EVs from patients with castration-resistant or castration-sensitive PC. (C) Comparison of log2 (abundance) of prostate-enriched gene proteins across all samples from plasma patients-derived LOs. The plot displays all the proteins detected in our patient-derived LOs among these 46 prostate-enriched genes. Boxplots show log2 (abundance) median and interquartile range. Error bars represent min and max values. (D) Heatmap of normalized LFQ intensity showing the proteins identified in LOs and in unfractionated plasma from the palmitoylated MS, showing that the majority of palm-proteins identified in purified LOs were not identified in unfractionated plasma. (E and F) Single-EV flow cytometry analysis of the select proteins expressed on the EV surface. (E) Quantification of the expression of the indicated proteins in molecules per EV. (F) Representative dot plots showing the size of the EVs and the expression level of the target proteins. CR, castration resistant; CS, castration sensitive.
Figure 4
Figure 4
Whole transcriptome analysis identifies distinct RNA cargo in the 2.8K and 100K PC3 EVs (A) Upset plot of the genes identified in the PC3 cell line (DESeq2 normalized counts > 10) between EV fractions and source cells. (B) PCA plot of replicates showing grouping by triplicate. (C) Heatmap (unsupervised clustering) of Z-scored gene expression of differentially expressed genes between the 2.8K and 100K fractions. (D) Volcano plot of differentially expressed genes (adjusted p < 0.05, log2 fold change > 1, base mean > 10) the 2,800g (green) and 100,000g fractions (blue). See also Figure S5.
Figure 5
Figure 5
Single-EV RNA-seq analysis of L-EVs confirms the abundance of mitochondrial transcripts (A) GSEA using the GO cell component category for Mitochondrion (GO:0005739) showing an enrichment of mitochondrial genes in both 2.8K and 10K when compared to the 100K (top and middle) and a higher enrichment of mitochondrial genes in the 10K fraction when compared to the 2.8K. Genes are ranked based on Wald’s test statistic of differential expression analysis. (B) Expression level of mitochondrial (MT) genes in droplets positive for LOs vs. S-EV differentially expressed genes (DEGs), LO markers, S-EV markers, and a set of randomly selected droplets. Statistical significance is obtained with Mann-Whitney two-tailed test. (C) Co-occurrence analysis of MT reads and reads of genes classified as (1) LOs vs. S-EV DEGs, (2) LO markers, and (3) S-EVs markers. x axis represents the number of reads requested to classify a drop as “MT positive.” y axis represents the odds ratio of each Fisher’s test, testing the independence of the positivity for MT markers (“MT positive”) and the positivity for other markers (“LO markers,” “LO vs. sEVs DEGs,” “sEVs,” and “other”). A positive odds ratio indicates enrichment for EVs positive for MT markers. Significance is shown by the shape of each point, with a threshold of 0.05. (D) Dimensionality reduction of single-EV RNA sequencing data (only drops containing high number [≥50] of reads are shown). Drops are colored based on the presence of MT and LO transcripts. MT-LO double-positive vesicles (yellow) are observed. (E) Dimensionality reduction of single-EV RNA sequencing data limited to vesicles positive for LO markers (only vesicles containing high number [≥50] of reads and positive for LO markers are shown). Drops are colored based on the presence of MT and LO transcripts. Clustering analysis identifies 3 clusters. Convex hulls indicate area containing 95%, 90%, 80%, 70%, and 60% of points of each cluster. Significant markers of each cluster are show in text boxes.
Figure 6
Figure 6
Comparison of protein and mRNA cargo in EV populations in the PC3 cell line (A) Upset plot of protein-coding genes identified in the proteome (P) and transcriptome (T; DESeq2 normalized counts > 10). (B) Spearman’s rank correlation of genes expressed in both the proteome and the transcriptome. Blue boxes: correlation of different sized EVs within the transcriptome or proteome. Red boxes: correlation of corresponding fractions between the proteome and transcriptome. (C) Heatmap of the LO-enriched analytes derived from the intersection of protein profiles of LOs obtained from different cancer cell lines with the mRNA profile of LOs obtained from the PC cell lines and with the protein profile of LOs from PC patient plasma. (D) PCTA analysis shows that the proteins and mRNAs enriched in the PC-derived 2.8K are significantly upregulated in patients with primary cancer vs. cancer-free individuals and are further upregulated in patients with mCRPC vs. primary cancer.

Update of

References

    1. Couch Y., Buzàs E.I., Vizio D.D., Gho Y.S., Harrison P., Hill A.F., Lötvall J., Raposo G., Stahl P.D., Théry C., et al. A brief history of nearly EV-erything - The rise and rise of extracellular vesicles. J. Extracell. Vesicles. 2021;10 doi: 10.1002/JEV2.12144. - DOI - PMC - PubMed
    1. Gerdtsson A.S., Setayesh S.M., Malihi P.D., Ruiz C., Carlsson A., Nevarez R., Matsumoto N., Gerdtsson E., Zurita A., Logothetis C., et al. Large Extracellular Vesicle Characterization and Association with Circulating Tumor Cells in Metastatic Castrate Resistant Prostate Cancer. Cancers (Basel) 2021;13:1056. doi: 10.3390/CANCERS13051056. - DOI - PMC - PubMed
    1. Yekula A., Minciacchi V.R., Morello M., Shao H., Park Y., Zhang X., Muralidharan K., Freeman M.R., Weissleder R., Lee H., et al. Large and small extracellular vesicles released by glioma cells in vitro and in vivo. J. Extracell. Vesicles. 2020;9 doi: 10.1080/20013078.2019.1689784. - DOI - PMC - PubMed
    1. Setayesh S.M., Hart O., Naghdloo A., Higa N., Nieva J., Lu J., Hwang S., Wilkinson K., Kidd M., Anderson A., et al. Multianalyte liquid biopsy to aid the diagnostic workup of breast cancer. NPJ Breast Cancer. 2022;8 doi: 10.1038/S41523-022-00480-4. - DOI - PMC - PubMed
    1. Zijlstra A., Di Vizio D. Size matters in nanoscale communication. Nat. Cell Biol. 2018;20:228–230. doi: 10.1038/S41556-018-0049-8. - DOI - PMC - PubMed

LinkOut - more resources