. 2025 Jun 7;9(1):167.
doi: 10.1038/s41698-025-00954-1.

Neoadjuvant therapy-induced immune dynamics and myeloid-associated resistance in advanced head and neck cancer

Affiliations

Neoadjuvant therapy-induced immune dynamics and myeloid-associated resistance in advanced head and neck cancer

Alisa Kimura et al. NPJ Precis Oncol. .

Abstract

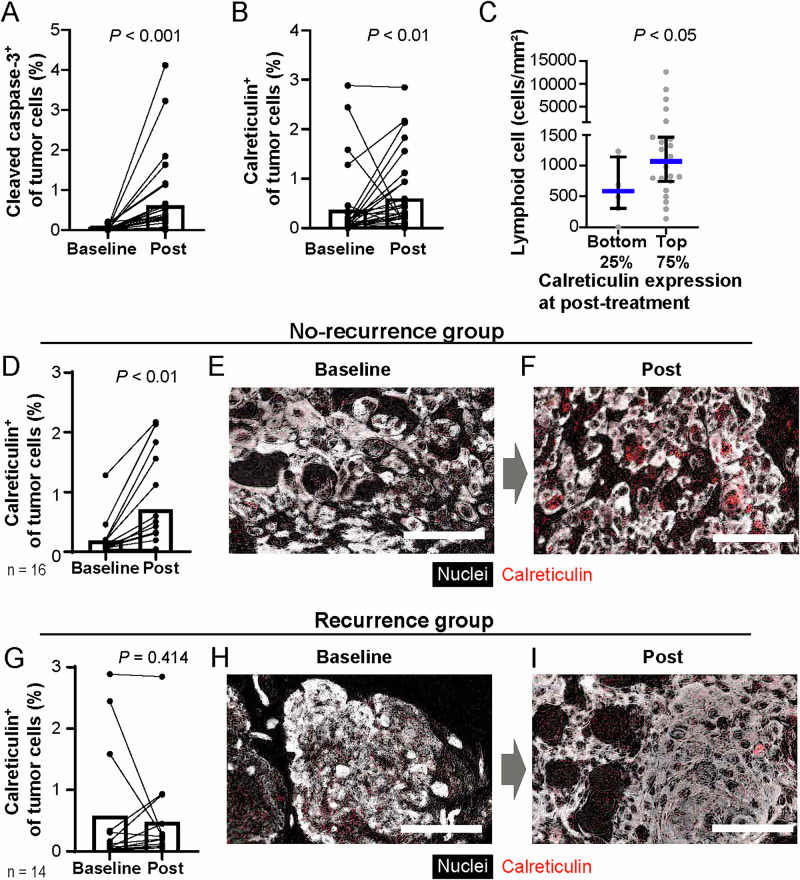
Understanding the dynamics of the tumor-immune ecosystem is crucial for advancing neoadjuvant strategies in cancer treatment. This study investigated alterations in the tumor-immune microenvironment related to the response to preoperative combination therapy with paclitaxel, carboplatin, and cetuximab in patients with advanced head and neck squamous cell carcinoma. Thirty patients underwent combination therapy. Biopsy or surgical specimens were obtained before and after treatment. Single-cell-based, 14-marker multiplex immunohistochemistry and image cytometry were employed to assess changes in immune cell densities and profiles. Three distinct immune profiles were identified: hypo-, lymphoid-, and myeloid-inflamed. Significant decreases in tumor volume and increases in CD45+ cells and programmed cell death ligand 1 (PD-L1) scores were observed in the hypo- and lymphoid-inflamed groups, whereas the myeloid-inflamed group showed minimal changes. After treatment, increased calreticulin expression in tumor cells, together with increased lymphoid cell lineages, was observed in non-recurrent cases. The myeloid-inflamed group exhibited higher expression of hypoxia inducible factor 1α and zinc finger E-box-binding homeobox 2, suggesting the presence of a hypoxic and metastasis-promoting environment. Spatial analysis revealed that responders had a high infiltration of T cells within tumor cell nests, whereas non-responders had fewer T cells, with β-catenin expression in cancer cells. Upregulated lymphocyte activation gene 3 in the myeloid-inflammation group, and PD-L1 dynamics suggest potential targets for further therapy. These findings highlight the need for targeted neoadjuvant strategies based on immune profiling.


Conflict of interest statement

Competing interests: The authors declare no competing non-financial interests but the following competing financial interests: T.T. is a paid consultant for Merck Biopharma and Rakuten Medical and receives speaker fees from Bristol-Myers Squibb, Merck Biopharma, Eisai Co., Ltd., Merck Sharp & Dohme Corp, Ono Pharmaceutical, Otsuka Pharmaceutical Factory, and Rakuten Medical. S.S. and H.O. are employees of SCREEN Holdings Co., Ltd. E.K. is a paid consultant for Roche Diagnostics and receives speaker fees from Chugai Pharmaceuticals. K.I. received research funding from SCREEN Holdings Co. Ltd.

Figures

Fig. 1
Fig. 1. Baseline immune profiles stratify longitudinal change of immune cell densities during chemo-targeted therapy.
A The study involved biopsy and surgical specimens from 30 patients with locally advanced head and squamous cell carcinoma (HNSCC) obtained prior to treatment (baseline), and after therapy (post-treatment). Tumor-immune microenvironmental changes and treatment outcomes were comparatively analyzed by stratifying baseline profiles according to immune cell density and composition. B Intratumoral cell densities (cells/mm2) of ten immune cell lineages were quantified, comparing baseline and post-treatment status after combination treatment with paclitaxel, carboplatin, and cetuximab. The classification of immune profiles into hypo-, lymphoid-, and myeloid-inflamed statuses was determined based on previously published cutoff values (see Materials and Methods). TREG = regulatory T cells, and TAM = tumor-associated macrophages. C Representative longitudinal changes stratified by baseline immune profiles. Pan-cytokeratin (pCK), lymphoid lineages (CD3, CD20, and NKp46), and myeloid lineages (CD68, CD66b, DC-LAMP, and tryptase) are shown with indicated colors. Scale bar = 100 μm. D Violin plots for tumor volume, density of CD45+ cells, and combined positive score (CPS) of programmed death-ligand 1 (PD-L1), comparing baseline and post-treatment stratified by immune profiles. Bars represent the median and interquartile ranges. Statistical significance was determined via Wilcoxon matched-pairs signed-rank tests. E, F Kaplan–Meier analysis of relapse-free survival (RFS) (E) and overall survival (OS) (F), stratified by immune profiles. Statistical significance was determined via Gehan-Breslow-Wilcoxon tests.
Fig. 2
Fig. 2. Cell death-related markers associated with changes in immune cell density and treatment outcomes during chemo-targeted therapy.
A, B Percentages of cleaved caspase-3+ (A) and calreticulin+ (B) tumor cells at baseline and following treatment (N = 30). Bars represent the median. C Cell density of lymphoid cells following treatment stratified by post-treatment calreticulin expression levels. Statistical difference was determined using the Mann-Whitney U test. D Calreticulin+ cells among total tumor cells were quantified, comparing baseline and post-treatment status in the non-recurrence group. Bars represent the median. E, F Images showing expression of calreticulin at baseline (E) and post-treatment (F). Colors are shown. Scale bar = 100 μm. G Calreticulin+ cells among total tumor cells were quantified, comparing baseline and post-treatment status in the recurrence group. Bars represent the median. H, I Images showing expression of calreticulin from baseline (H) and post-treatment (I). Colors are shown. Scale bar = 100 μm. Statistical differences in (A, B and DI) were determined via Wilcoxon matched-pairs signed-rank tests.
Fig. 3
Fig. 3. Myeloid-inflamed tumors feature high expression of hypoxia and metastasis-promoting factors, and spatial exclusion of T cells.
A Representative image of myeloid-inflamed tissue visualized by biomarkers, including hypoxia inducible factor-1α (HIF1α), zinc finger E-box-binding homeobox-2 (ZEB2), β-catenin, Ki67, tissue inhibitor of metalloproteinases-1 (TIMP1), and pan-cytokeratin (pCK) with indicated colors. Scale bar = 100 μm. B, C Percentages of HIF1α+ (B) and ZEB2+ (C) tumor cells, comparing the myeloid- and non-myeloid-inflamed groups at baseline. Bars represent the median and interquartile ranges. Statistical difference was determined via Mann-Whitney U test. D, E Percentages of HIF1α+ (D), and ZEB2+ (E) of tumor cells, comparing baseline and post-treatment status (N = 30). F Percentages of nuclear β-catenin+ of tumor cells in the myeloid-inflamed group, comparing baseline and post-treatment status (n = 10). Statistical differences in (DF) were determined via Wilcoxon matched-pairs signed-rank tests. Bar graphs represent mean values. G, H Images of representative post-treatment tissue from a responder (G) and a non-responder (H). Biomarkers and colors are shown. Scale bar = 300 μm.
Fig. 4
Fig. 4. Longitudinal analysis of LAG3 and PD-L1 expression in the patients with HNSCC undergoing chemo-targeted therapy.
A Percentages of LAG3+ non-tumor cells (pCK) at baseline and post-treatment (N = 30). Statistical significances were determined via Wilcoxon matched-pairs signed-rank tests. B Violin plots showing the percentages of LAG3+ non-tumor cells (pCK), comparing baseline and post-treatment, stratified by immune profiles. Dots in the violin plots represent individual cases, and vertical bars represent the median, and interquartile ranges. Statistical differences were determined via Wilcoxon signed-rank tests. C, D Longitudinal changes in the combined positive score (CPS) of PD-L1, comparing high baseline CPS ( ≥ 20) (C) and low baseline CPS ( < 20) (D). Statistical differences were determined via Wilcoxon signed-rank tests.

References

    1. Johnson, D. E. et al. Head and neck squamous cell carcinoma. Nat. Rev. Dis. Prim.6, 92 (2020). - PMC - PubMed
    1. Tsujikawa, T. et al. Quantitative multiplex immunohistochemistry reveals myeloid-inflamed tumor-immune complexity associated with poor prognosis. Cell Rep.19, 203–217 (2017). - PMC - PubMed
    1. Okuyama, K., Naruse, T. & Yanamoto, S. Tumor microenvironmental modification by the current target therapy for head and neck squamous cell carcinoma. J. Exp. Clin. Cancer Res.42, 114 (2023). - PMC - PubMed
    1. Heeren, A. M. et al. Neoadjuvant cisplatin and paclitaxel modulate tumor-infiltrating T cells in patients with cervical cancer. Cancer Immunol. Immunother.68, 1759–1767 (2019). - PMC - PubMed
    1. Smith, J. D. et al. Tumor immune microenvironment alterations using induction cetuximab in a phase II trial of deintensified therapy for p16-positive oropharynx cancer. Head. Neck45, 1281–1287 (2023). - PubMed

LinkOut - more resources