. 2025 Jun 7;11(1):269.
doi: 10.1038/s41420-025-02540-7.

LMNB2-mediated high PD-L1 transcription triggers the immune escape of hepatocellular carcinoma

Affiliations

LMNB2-mediated high PD-L1 transcription triggers the immune escape of hepatocellular carcinoma

Yuxuan Li et al. Cell Death Discov. .

Abstract

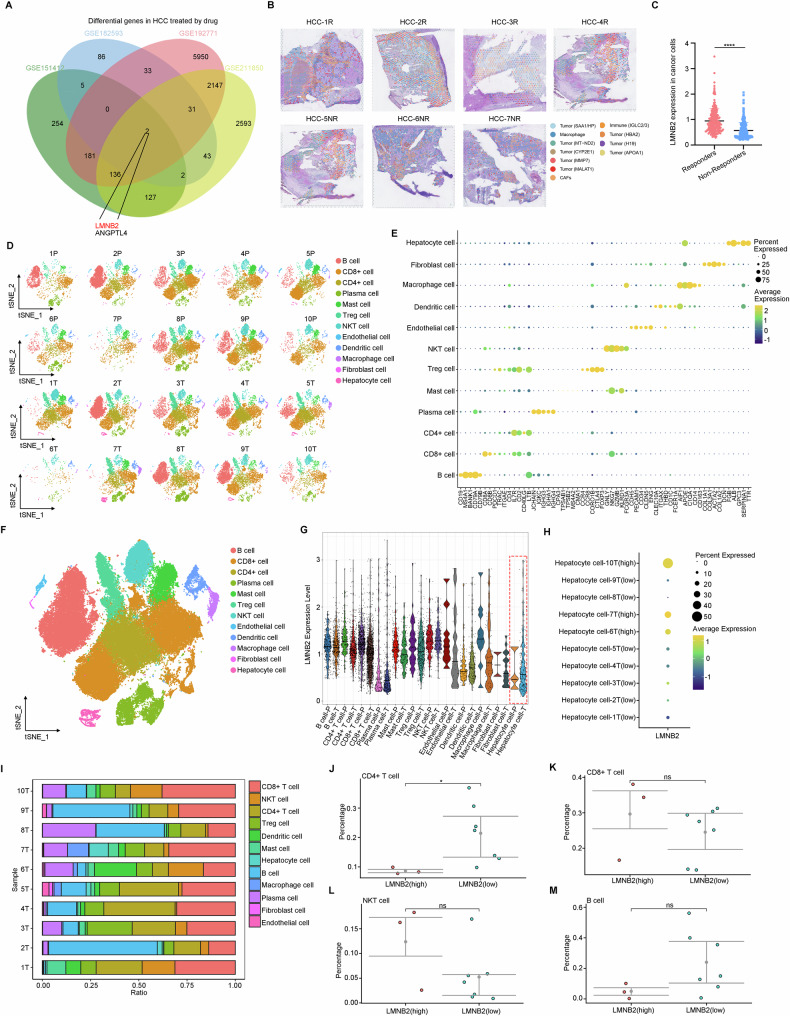
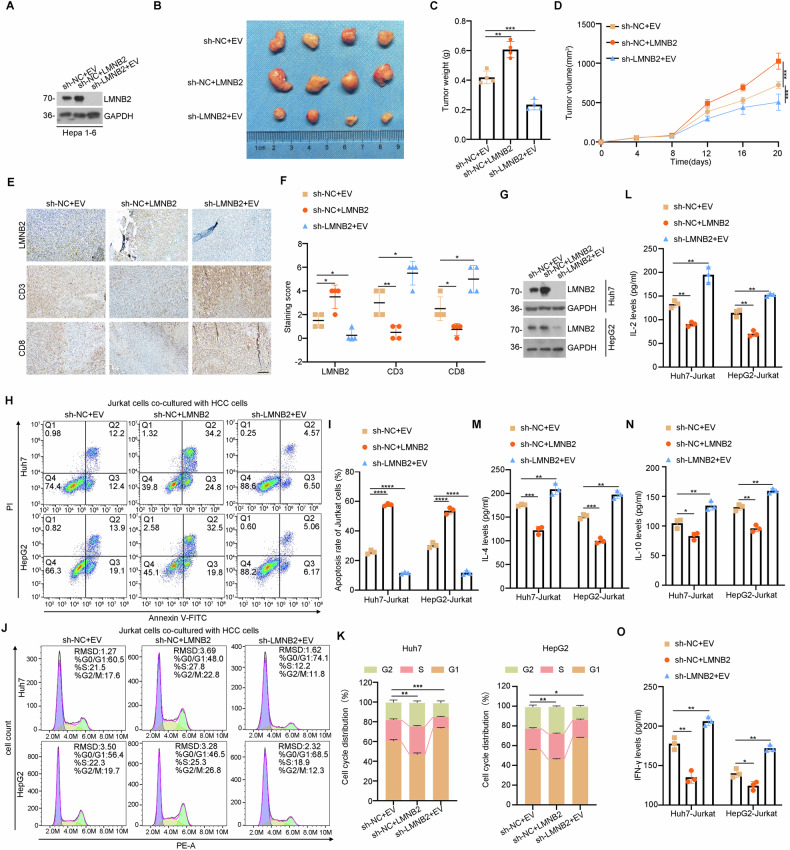
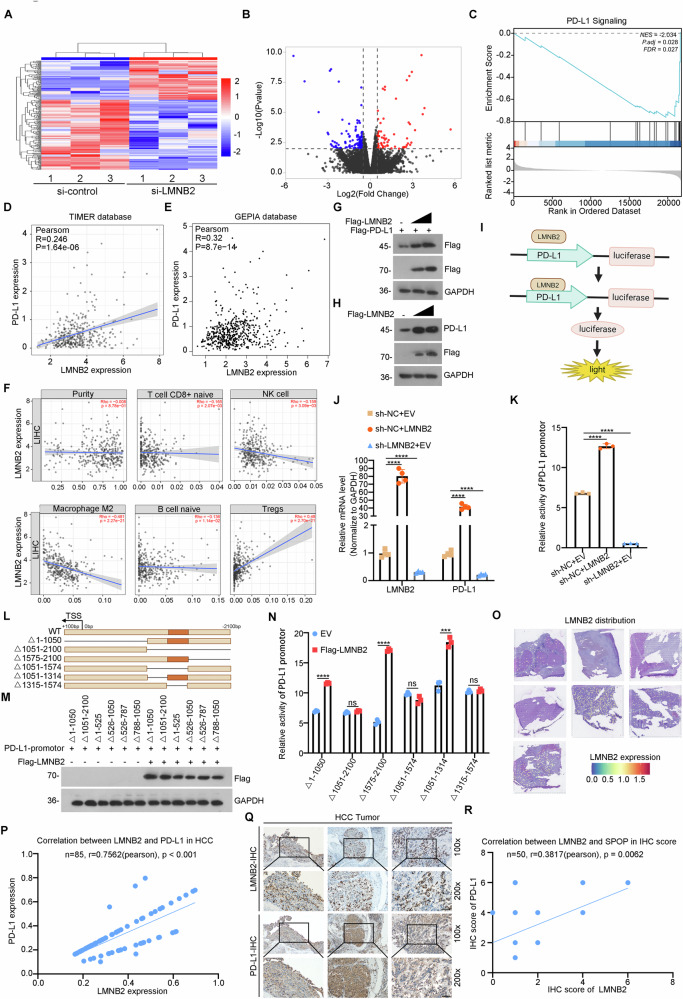
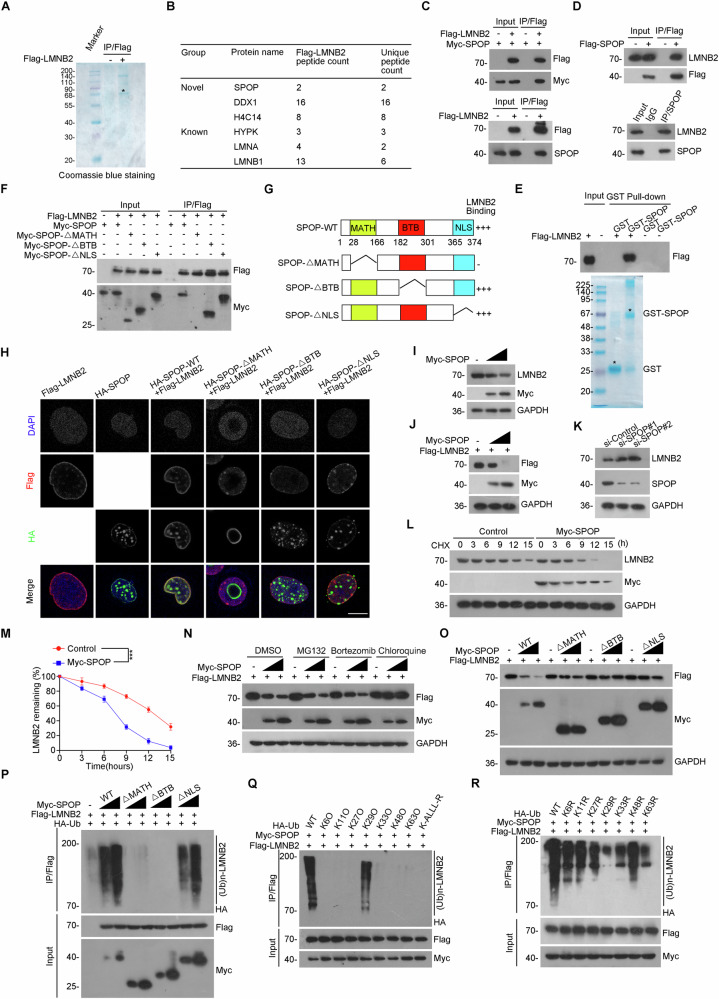
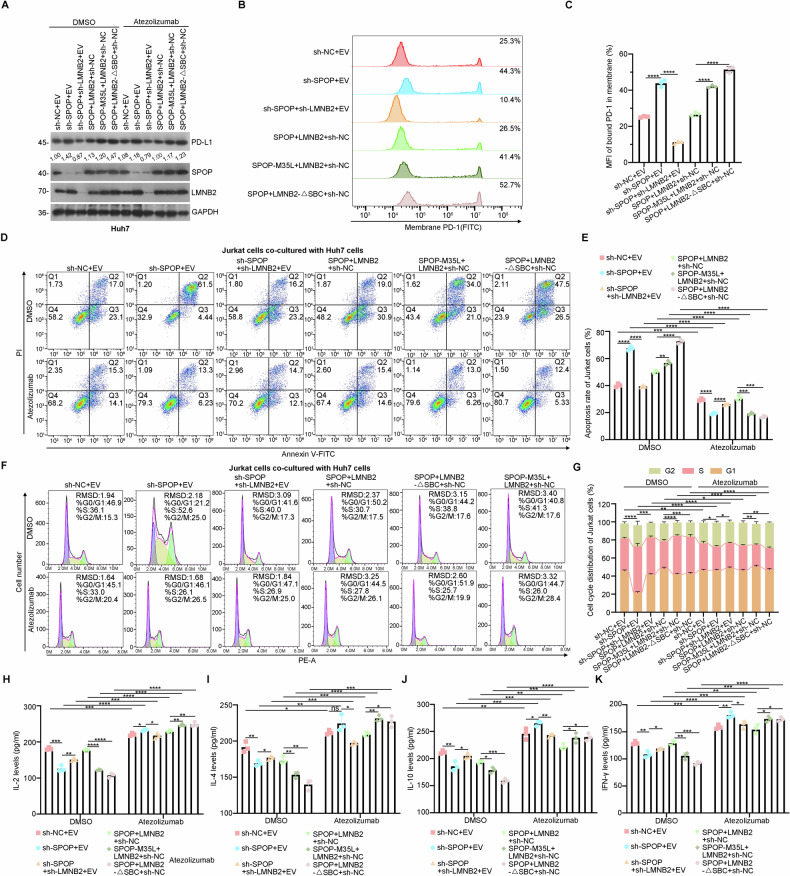
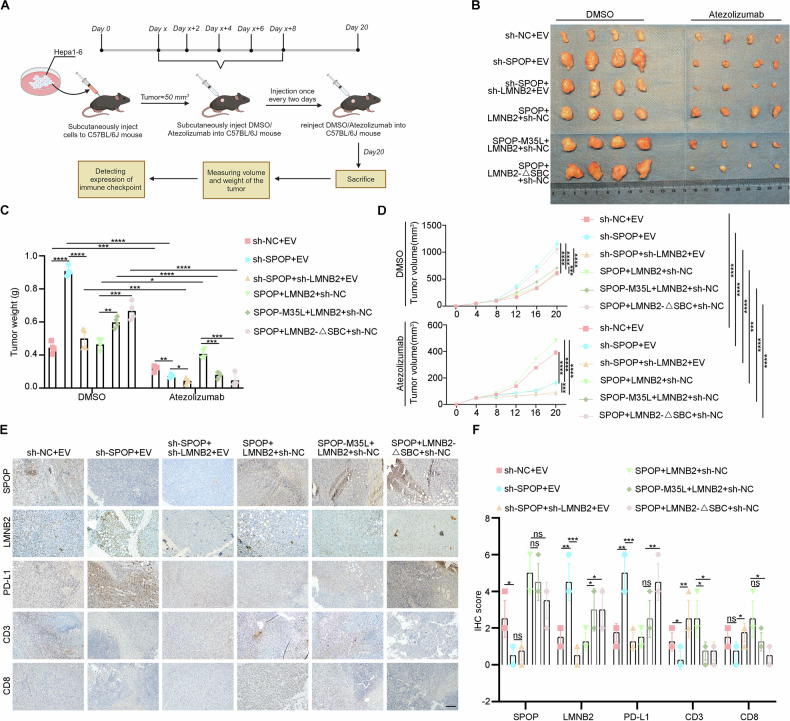
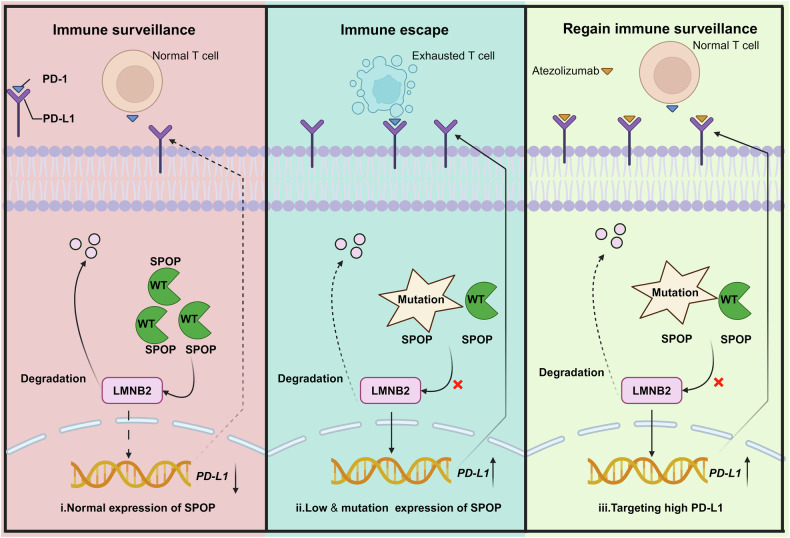
While immune checkpoint inhibitors targeting programmed cell death-ligand 1 (PD-L1) demonstrate clinical efficacy in hepatocellular carcinoma (HCC), tumor cells frequently evade immune surveillance through PD-L1 overexpression, a phenomenon whose regulatory mechanisms remain poorly understood. Through integrated analysis of single-cell transcription sequence data, we identified aberrant upregulation of Lamin B2 (LMNB2) specifically in immunotherapy-sensitive HCC patients. Functional characterization revealed that LMNB2 acts as a transcriptional regulator of PD-L1, potentiating immune escape mechanisms in HCC cells during co-culture with Jurkat cells. Notably, we discovered that speckle-type POZ protein (SPOP) directly interacts with LMNB2 to mediate its ubiquitination and proteasomal degradation, thereby maintaining physiological PD-L1 expression levels. Clinically relevant SPOP mutations or reduced SPOP expression impaired this regulatory mechanism, leading to LMNB2 accumulation and subsequent PD-L1 hyperactivation. Importantly, combinatorial targeting of LMNB2 with Atezolizumab (PD-L1 inhibitor) displayed a synergistic effect on suppressing tumor progression both in vitro and in vivo, particularly in HCC models with SPOP mutations or LMNB2 overexpression. These findings unveil a novel ubiquitination-dependent regulatory axis in HCC immune evasion and propose targeted co-inhibition strategies to overcome HCC immunotherapy resistance.


Conflict of interest statement

Competing interests: The authors declare no competing interests. Ethics: All methods of this study were performed in accordance with relevant guidelines and regulations. All human samples involved in this study were reviewed and approved by the Ethics Committee of Ningbo University (NBU-2024-313). Animal studies were reviewed and approved by the Animal Ethics Committee of the Laboratory Animal Center of Ningbo University (AEWC-NBU20240311).

Figures

Fig. 1
Fig. 1. LMNB2 is significantly elevated in HCC, negatively related to immune infiltration.
A Intersection of upregulated DEGs in drug-resistant HCC samples (GSE211850, GSE182593, GSE151412, and GSE192771). B Annotation and clustering for ST profiling. C Analysis expression of LMNB2 in HCC cells between patient responders and patient non-responders. DF Debatching effect, clustering, and annotation for sc-RNA seq of 10 HCC samples (T) and 10 normal liver samples (P) (GSE235057). G Expression of LMNB2 in hepatocyte cells in sc-RNA seq of total10 HCC samples. H Expression of LMNB2 in hepatocyte cells in sc-RNA seq of separate 10 HCC samples. I Proportion of cell types in scRNA-seq of 10 HCC samples. J Proportion of CD4+ T cells in the 10 HCC samples grouped with high/low LMNB2 expression of hepatocyte cells. K Proportion of CD8+ T cells in the 10 HCC samples grouped with high/low LMNB2 expression of hepatocyte cells. L Proportion of NKT cells in the 10 HCC samples grouped with high/low LMNB2 expression of hepatocyte cells. M Proportion of B cells in the 10 HCC samples grouped with high/low LMNB2 expression of hepatocyte cells. Data are shown as mean ± SD (n ≥ 3). *p < 0.05, ns p ≥ 0.05.
Fig. 2
Fig. 2. LMNB2 can promote tumor growth by inducing T-cell apoptosis.
A WB verified the overexpression and knockdown efficiency of LMNB2 in Hepa1-6 cells. B Schematic representation of xenograft tumors with sh-NC + EV, sh-NC + LMNB2, and sh-LMNB2 + EV. C Weight of xenograft tumors of sh-NC + EV, sh-NC + LMNB2, and sh-LMNB2 + EV. D Volume of xenograft tumors of sh-NC + EV, sh-NC + LMNB2, and sh-LMNB2 + EV. E IHC staining of LMNB2, CD3, and CD8 in sh-NC + EV, sh-NC + LMNB2, and sh-LMNB2 + EV in xenograft tumors. Scale bar, 200 μm. F IHC staining scores for LMNB2, CD3, and CD8 in sh-NC + EV, sh-NC + LMNB2, and sh-LMNB2 + EV in xenograft tumors. G WB verified the overexpression and knockdown efficiency of LMNB2 in Huh7 and HepG2 cell lines. H Apoptosis of Jurkat cells co-cultured with Huh7/HepG2 cells treated with sh-NC + EV, sh-NC + LMNB2, or sh-LMNB2 + EV was detected by flow cytometry. I Statistical analysis of apoptotic levels in Jurkat cells (H). J The cell cycle of Jurkat cells co-cultured with Huh7/HepG2 cells treated with sh-NC + EV, sh-NC + LMNB2, and sh-LMNB2 + EV was analyzed by flow cytometry. K Cell cycle statistics of Jurkat cells (J). LO The levels of IL-2, IL-4, IL-10, and IFN-γ produced by Jurkat cells were detected using ELISA. Data are shown as mean ± SD (n ≥ 3). *p < 0.05, **p < 0.01, ***p < 0.001, ****p < 0.0001.
Fig. 3
Fig. 3. LMNB2 is a bona fide transcription factor of PD-L1.
A RNA-seq analysis of control and LMNB2 knockdown Huh7 cells. B Volcano map of DEGs in control and LMNB2 knockdown Huh7 cells. C GSEA analysis of PD-L1 signaling in control and LMNB2 knockdown Huh7 cells. D Correlation analysis between LMNB2 and PD-L1 expression in the TIMER database. E Correlation analysis between LMNB2 and PD-L1 expression in the GEPIA database. F Correlation analysis between LMNB2 and immune cell infiltration in HCC using the TIMER database. G LMNB2 promotes the protein expression of exogenous PD-L1 in HepG2 cells. H LMNB2 promotes the protein expression of endogenous PD-L1 in HepG2 cells. I Model diagram of LMNB2 binding to the PD-L1 promoter to promote its transcription. J LMNB2 promotes the mRNA expression of PD-L1. K LMNB2 promotes the activity of PD-L1. L Model diagram of the six truncated PD-L1 promoters. M WB verified the overexpression of LMNB2 in 293T cells for dual-luciferase reporter analysis. N Statistical of the LMNB2 effect on the activity of six truncated PD-L1 promoters (O). Distribution of LMNB2 in ST-RNA-seq of HCC samples. P Correlation analysis between LMNB2 and PD-L1 in ST-RNA-seq in HCC samples. Q IHC staining of LMNB2 and PD-L1 in HCC samples. Scale bar, 200 μm. R Correlation analysis between LMNB2 and SPOP IHC scores. Data are shown as mean ± SD (n ≥ 3). ***p < 0.001, ****p < 0.0001.
Fig. 4
Fig. 4. SPOP promotes LMNB2 lysosome-mediated degradation through K29-linkage ubiquitination.
A Coomassie blue staining for the enrichment of LMNB2. B Mass spectrometry of related proteins in LMNB2 enrichment. C and D Interaction between LMNB2 and SPOP. E Interaction between LMNB2 and SPOP in vitro. F Interaction between LMNB2 and SPOP-WT, SPOP-ΔMATH, SPOP-ΔBTB, and SPOP-ΔNLS. G Mode diagram of binding ability between LMNB2 and SPOP-WT, SPOP-ΔMATH, SPOP-ΔBTB, or SPOP-ΔNLS. H Co-localization of LMNB2, SPOP-WT, SPOP-ΔMATH, SPOP-ΔBTB, and SPOP-ΔNLS. Scale bar, 50 μm. IK SPOP promotes the protein expression of LMNB2. L and M Effect of SPOP on the half-life of LMNB2. N Identifying degradation pathway of LMNB2 induced by SPOP. O Effects of SPOP-WT, SPOP-ΔMATH, SPOP-ΔBTB, and SPOP-ΔNLS on LMNB2 degradation. P Effects of SPOP-WT, SPOP-ΔMATH, SPOP-ΔBTB, and SPOP-ΔNLS on LMNB2 ubiquitination. Q and R Identification of ubiquitination linkage of LMNB2 induced by SPOP. Data are shown as mean ± SD (n ≥ 3). ***p < 0.001.
Fig. 5
Fig. 5. SPOP-induced immune surveillance depends on LMNB2‑PD‑L1 axis in Huh7 cells.
A Huh7 cells achieving sh-NC + EV, sh-SPOP + EV, sh-SPOP+sh-LMNB2 + EV, SPOP + LMNB2 + sh-NC, SPOP + LMNB2-△SBC+sh-NC and SPOP-M35L + LMNB2 + sh-NC were co-cultured with Jurkat cells for 24 h after treatment with DMSO or Atezolizumab (10 ng/mL). WB of Huh7 cells in the HCC cell-Jurkat cell co-culture system for the detection of PD-L1 expression levels. All quantitation was normalized to the protein level of GAPDH in the sh-NC + EV group. B Huh7 cells achieving the above treatment were co-cultured with Jurkat cells for 24 h. Flow cytometry analysis of PD-1 binding on Huh7 cell surface. C Statistics of mean fluorescence intensity (MFI) for PD-1 in (B). D Huh7 cells achieving the above treatment were co-cultured with Jurkat cells for 24 h after treatment with DMSO or Atezolizumab (10 ng/ml). Apoptosis levels in Jurkat cells were detected by flow cytometry. E Statistical analysis of apoptotic levels in Jurkat cells (D). F Huh7 cells achieving the above treatment were co-cultured with Jurkat cells for 24 h after treatment with DMSO or Atezolizumab (10 ng/ml). The cell cycles of Jurkat cells were detected by flow cytometry. G Cell cycle statistics of Jurkat cells (F). HK The levels of IL-2, IL-4, IL-10, and IFN-γ produced by Jurkat cells were detected using ELISA. Data are shown as mean ± SD (n ≥ 3). *p < 0.05, **p < 0.01, ***p < 0.001, ****p < 0.0001.
Fig. 6
Fig. 6. Atezolizumab counteracts defective SPOP-LMNB2-PD-L1 axis-induced immune escape of HCC in vivo.
A Mode diagram of Atezolizumab injection in C57BL/6 J mice with a subcutaneous tumor. B Schematic representation of xenograft tumors of sh-NC + EV, sh-SPOP + EV, sh-SPOP + sh-LMNB2 + EV, SPOP + LMNB2 + sh-NC, SPOP + LMNB2-△SBC + sh-NC, and SPOP-M35L + LMNB2 + sh-NC groups in DMSO or Atezolizumab. C Weight of xenograft tumors in the above groups. D Volume of xenograft tumor in the above group. E IHC staining of SPOP, LMNB2, PD-L1, CD3, and CD8 in xenograft tumors. Scale bar, 200 μm. F Statistical analysis of the IHC staining scores of SPOP, LMNB2, PD-L1, CD3, and CD8 in xenograft tumors. Data are shown as mean ± SD (n ≥ 3). *p < 0.05, **p < 0.01, ***p < 0.001, ****p < 0.0001, ns p ≥ 0.05.
Fig. 7
Fig. 7
Schematic of the proposed mechanism through which PD-L1 transcription activation induced by SPOP dysfunction induces immune escape of HCC cells.

Similar articles

References

    1. Bray F, Laversanne M, Sung H, Ferlay J, Siegel RL, Soerjomataram I, et al. Global cancer statistics 2022: GLOBOCAN estimates of incidence and mortality worldwide for 36 cancers in 185 countries. CA Cancer J Clin. 2024;74:229–63. - PubMed
    1. Chakraborty E, Sarkar D. Emerging therapies for hepatocellular carcinoma (HCC). Cancers (Basel) 2022;14. - PMC - PubMed
    1. Yi M, Zheng X, Niu M, Zhu S, Ge H, Wu K. Combination strategies with PD-1/PD-L1 blockade: current advances and future directions. Mol Cancer. 2022;21:28. - PMC - PubMed
    1. Gao K, Shi Q, Gu Y, Yang W, He Y, Lv Z, et al. SPOP mutations promote tumor immune escape in endometrial cancer via the IRF1–PD-L1 axis. Cell Death Differ. 2023;30:475–87. - PMC - PubMed
    1. Reinhardt C, Ochsenbein AF. Immune checkpoints regulate acute myeloid leukemia stem cells. Leukemia 2025. 10.1038/s41375-025-02566-x. - PMC - PubMed

LinkOut - more resources