. 2025 Jun 7;11(1):97.
doi: 10.1038/s41522-025-00723-9.

The role of gut microbiota-gonadal axis in ovary activation of Asian honey bee (Apis cerana) queens

Affiliations

The role of gut microbiota-gonadal axis in ovary activation of Asian honey bee (Apis cerana) queens

Chonghui Zhao et al. NPJ Biofilms Microbiomes. .

Abstract

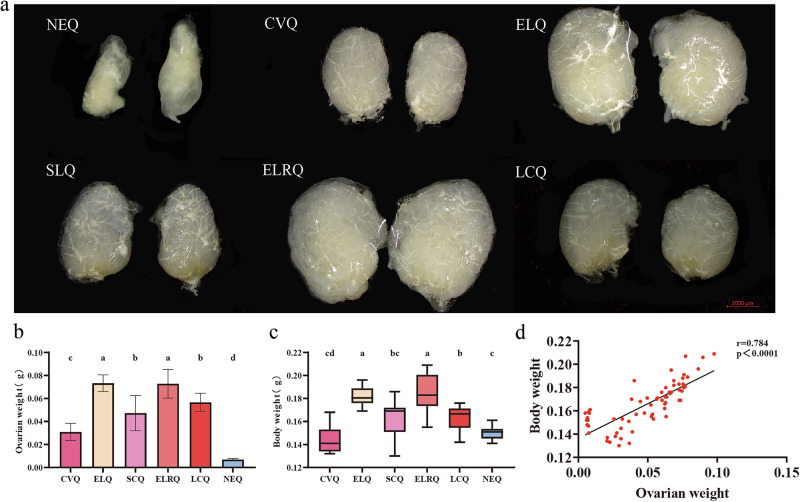
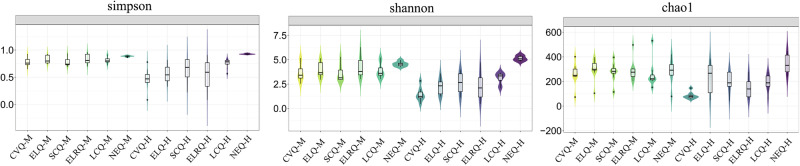
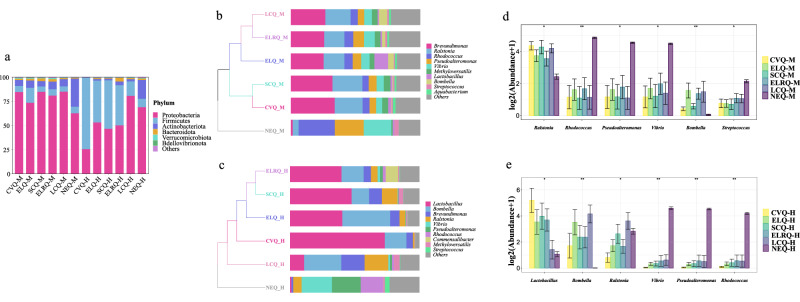
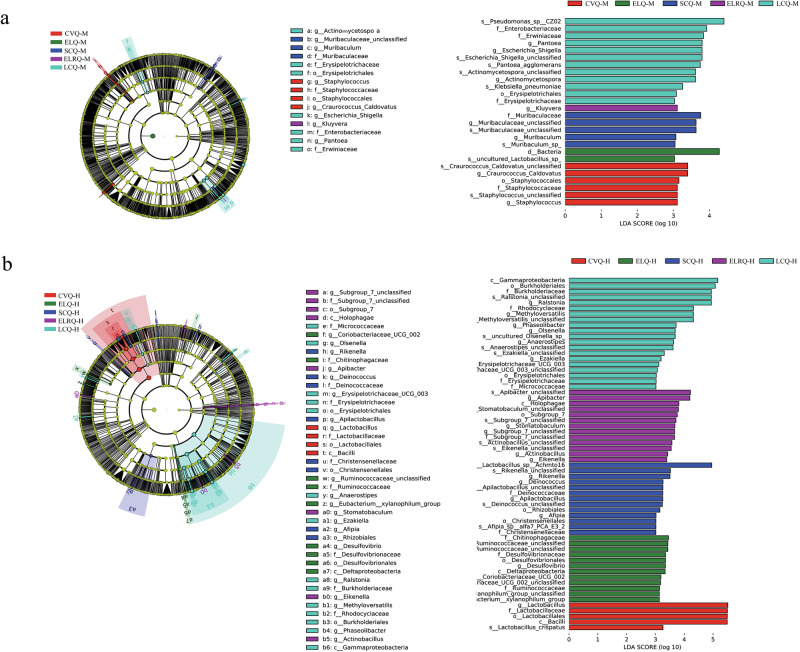
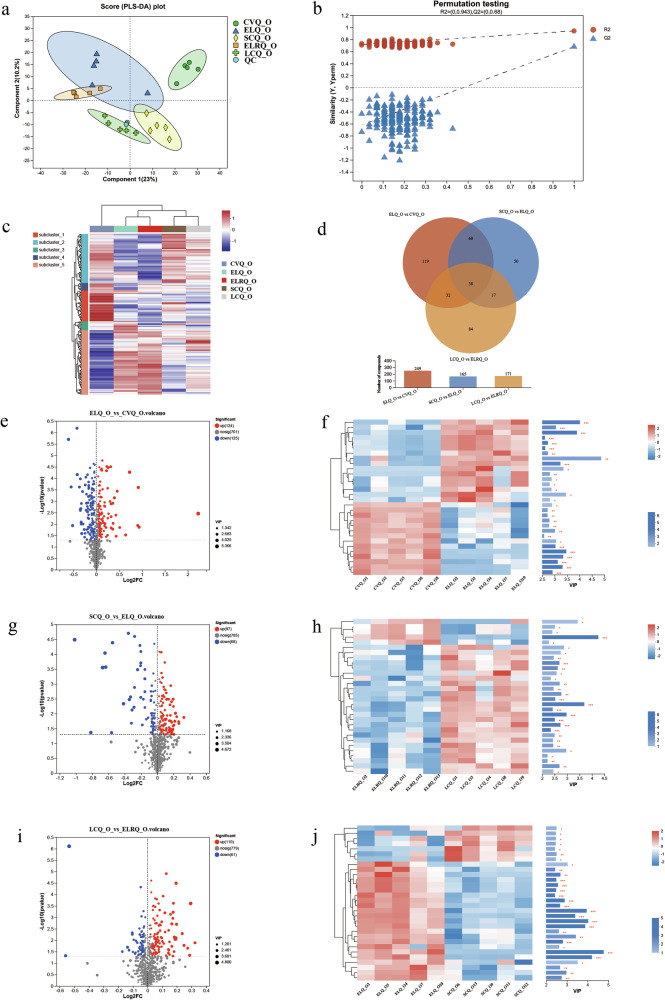
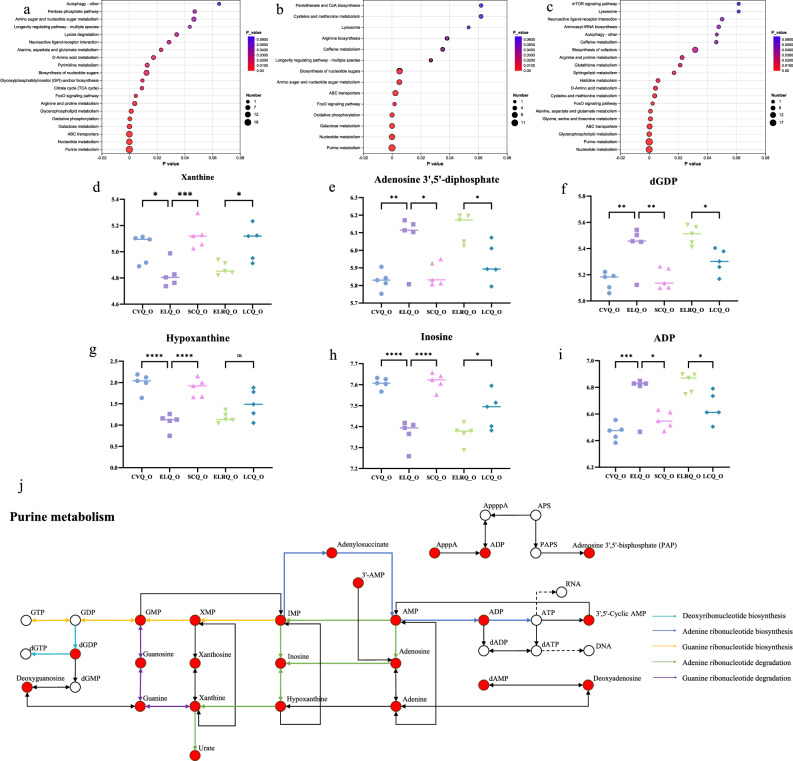
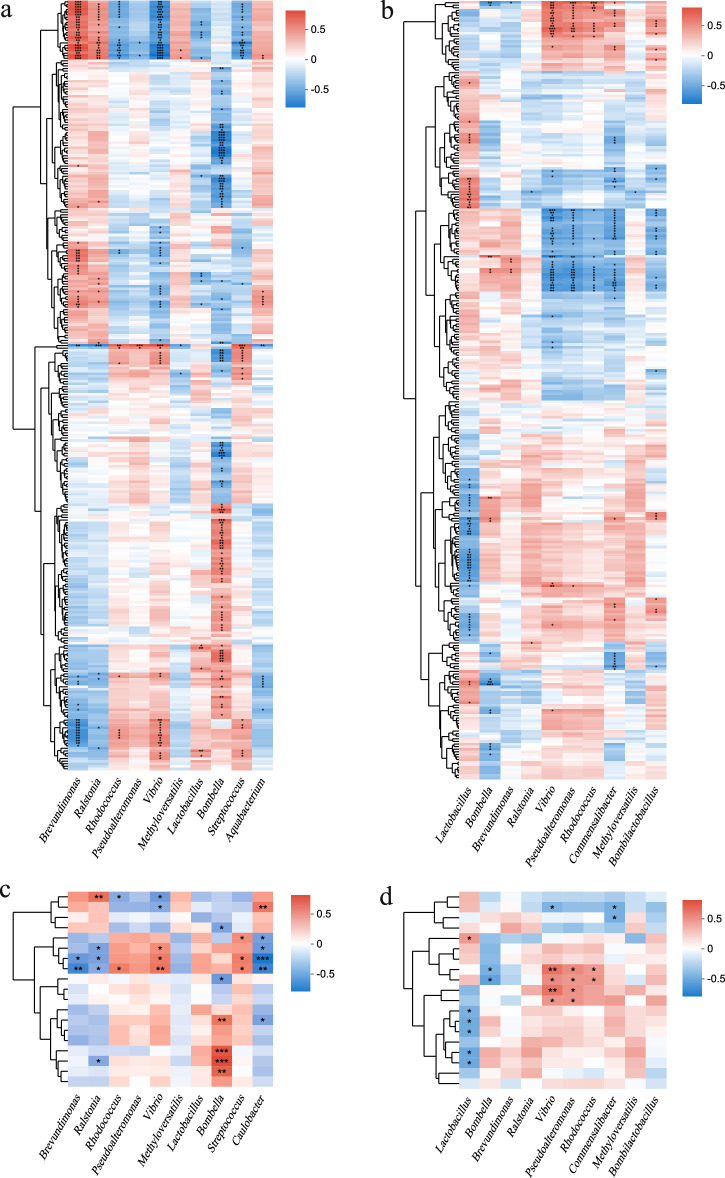
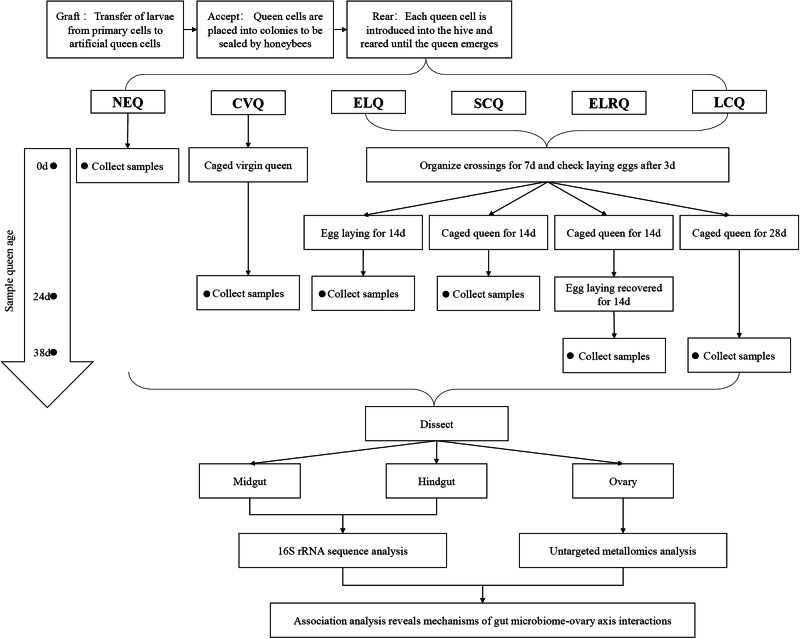
The gut microbiota-gonadal axis is increasingly recognized, but its reproductive roles remain unclear. Here, we used the Asian honey bee Apis cerana queens as a model to investigate the role of the gut microbiota-gonadal axis on ovary activation. By artificially caging and releasing the mated queens for a short or long period and monitoring the morphological changes of their ovaries, we confirmed that the activation and suppression of the queen ovary could be switched quickly. We found that the ovary weight was positively correlated with the body weight. 16S rRNA sequencing showed ovarian deactivation reduced gut Lactobacillus abundance. Untargeted metabolomics identified purine metabolism as the dominant ovarian pathway, while correlation analyses implicated Lactobacillus in modulating ovarian morphology through purine signaling. This study elucidates microbiota-gonadal crosstalk governing reproduction, providing mechanistic insights with translational potential for reproductive health management.


Conflict of interest statement

Competing interests: The authors declare no competing interests.

Figures

Fig. 1
Fig. 1. Effects of caged queen bees on ovary and body weight.
a Microscopic image taken of the queen’s ovary morphology, uniform use of 2000 μm scale. b Weight of the queens’ ovaries. c Weight of the queen’s body weight. d Correlation analysis of the queen’s ovary weight and body weight. (NEQ, n = 10. CVQ, n = 11. ERQ, n = 10. SCQ, n = 11. ELRQ, n = 13. LCQ, n = 10.).
Fig. 2
Fig. 2. Alpha diversity of the queen’s gut microbiome.
M represents the midgut and H represents the hindgut. (CVQ, n = 8. ERQ, n = 10. SCQ, n = 8. ELRQ, n = 10. LCQ, n = 8. NEQ, n = 6.).
Fig. 3
Fig. 3. Community composition of the queen bee gut.
a Horizontal community distribution of the middle and hindgut phyla. b Horizontal community distribution and clustering of midgut genera. c Horizontal community distribution and clustering of hindgut genera. d Differential genera in the midgut. e Differential genera in the hindgut.
Fig. 4
Fig. 4. LEfSe (LDA effect size) analysis of the microbiota of the queen bee midgut and hindgut.
a LEfSe analysis of the midgut. b LEfSe analysis of the hindgut.
Fig. 5
Fig. 5. Metabolite changes in the ovary.
a OPLS-DA analysis of ovarian metabolomics. b Validation of OPLS-DA analysis. c Sample and metabolite clustering analysis. e Volcano plot of ovarian differential metabolites in ELQ_O vs CVQ_O. d Venn diagram of multiple comparisons. f Clustering heatmaps and VIP bar graphs of ELQ_O vs CVQ_O. g Volcano plot of ovarian differential metabolites in SCQ_O vs ELQ_O. h Clustering heatmaps and VIP bar graphs of SCQ_O vs ELQ_O. i Volcano plot of ovarian differential metabolites in LCQ_O vs ELRQ_O. j Clustering heatmaps and VIP bar graphs of LCQ_O vs ELRQ_O. The length of the bar in the metabolite VIP bar graph indicates the contribution of the metabolite to the difference between the two groups. Bar colors indicate the significance of the metabolite difference between the two sample groups: * represents P < 0.05, ** represents P < 0.01, and *** represents P < 0.001.
Fig. 6
Fig. 6. KEGG pathway enrichment analysis of differentially accumulated metabolites.
a KEGG enrichment analysis (ELQ_O vs CVQ_O). b KEGG enrichment analysis (SCQ_O vs ELQ_O). c KEGG enrichment analysis (LCQ_O vs ELRQ_O). The horizontal coordinate is the enrichment significance p value, where a p value less than 0.05 is considered a significant enrichment term; the vertical coordinate is the KEGG pathway. The size of the bubbles in the graph represents the number of compounds enriched in the pathway in the metabolic set. di Changes in differential metabolites in purine metabolism, * represents P < 0.05, ** represents P < 0.01, *** represents P < 0.001, and **** represents P < 0.0001. j Response networks of differential metabolites in purine metabolic pathway. The red nodes are the differential metabolites in this study.
Fig. 7
Fig. 7. Correlation between gut bacteria and ovarian metabolites.
a Correlation analysis of midgut dominant bacteria with ovarian metabolites. b Correlation analysis of hindgut dominant bacteria with ovarian metabolites. c Correlation analysis of midgut dominant bacteria with metabolites in purine metabolism. d Correlation analysis of hindgut dominant bacteria with metabolites in purine metabolism. Each grid in the figure represents the correlation between two attributes (ovarian metabolites and gut bacteria). The correlation coefficients in each square represent positive (red) and negative (blue) relationships. Statistically significant correlations are marked with asterisks (*). * represents P < 0.05, ** represents P < 0.01, *** represents P < 0.001.
Fig. 8
Fig. 8. Schematic overview of study design.
NEQ newly emerged queen, CVQ caged virgin queen, ELQ egg-laying queen, SCQ shortly-caged queen, ELRQ egg-laying recovered queen, LCQ longly-caged queen.

Similar articles

References

    1. Ashonibare, V. J., Akorede, B. A., Ashonibare, P. J., Akhigbe, T. M. & Akhigbe, R. E. Gut microbiota-gonadal axis: the impact of gut microbiota on reproductive functions. Front. Immunol.15, 1346035 (2024). - PMC - PubMed
    1. Argaw-Denboba, A. et al. Paternal microbiome perturbations impact offspring fitness. Nature629, 652–659 (2024). - PMC - PubMed
    1. Fu, Y. et al. Landscape of the gut mycobiome dynamics during pregnancy and its relationship with host metabolism and pregnancy health. Gut73, 1302–1312 (2024). - PMC - PubMed
    1. Xu, B. et al. Multi-omics analysis reveals gut microbiota-ovary axis contributed to the follicular development difference between Meishan and Landrace × Yorkshire sows. J. Anim. Sci. Biotechnol.14, 68 (2023). - PMC - PubMed
    1. Qi, X., Yun, C., Pang, Y. & Qiao, J. The impact of the gut microbiota on the reproductive and metabolic endocrine system. Gut Microbes13, 1894070 (2021). - PMC - PubMed

Substances

LinkOut - more resources