. 2025 Jun 7;24(1):168.
doi: 10.1186/s12943-025-02360-4.

Targeting PERP promotes anti-tumor immunity in HNSCC by regulating tumor immune microenvironment and metabolic homeostasis

Affiliations

Targeting PERP promotes anti-tumor immunity in HNSCC by regulating tumor immune microenvironment and metabolic homeostasis

Xueying Wang et al. Mol Cancer. .

Abstract

Background: PERP may have the potential to function as an oncogene. However, the precise function, prognostic value, and predictive significance remain shrouded in ambiguity.

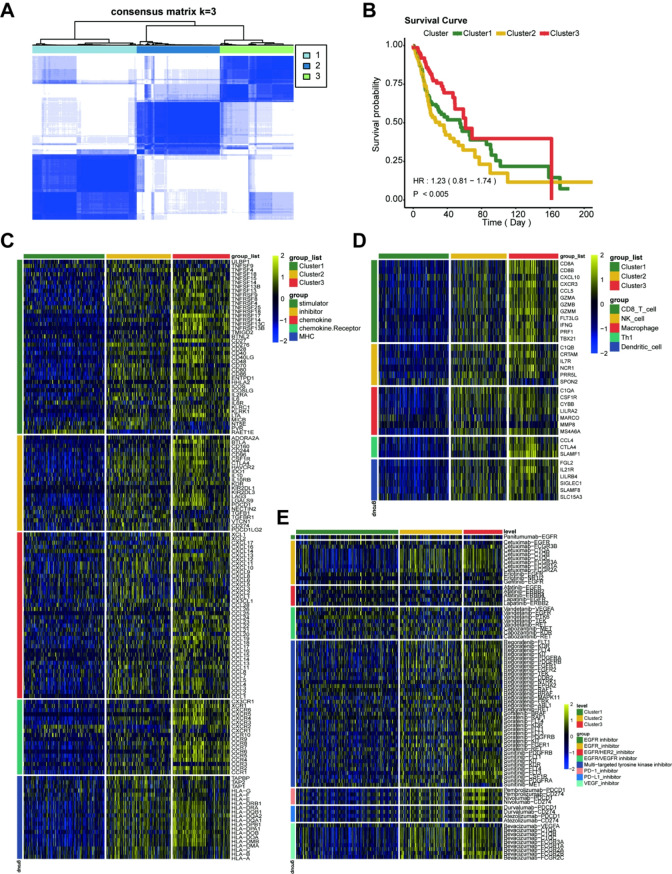
Methods: We conducted an in-depth analysis using pan-cancer RNA sequencing data and various online web tools to investigate the correlation between PERP and crucial clinical outcomes such as prognosis, tumor microenvironment, and tumor metabolism. In addition, we explored the tumor-promoting role of PERP and its potential mechanisms through models such as immunofluorescence staining, flow cytometry, cell proliferation assays, wound healing assays, cell migration assays, mass spectrometry analysis and isotope tracing. Further in vivo models confirmed the functional consistency of PERP across pan-cancer. Finally, we analyzed the potential of PERP as a predictive factor for immunotherapy sensitivity in a clinical cohort.

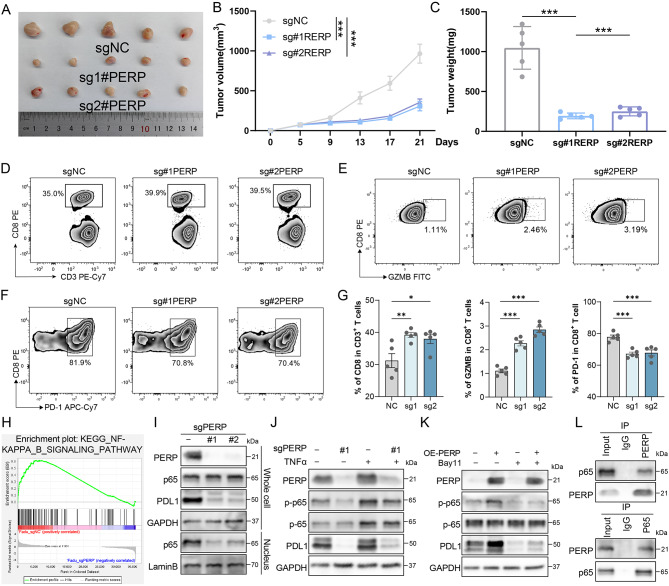
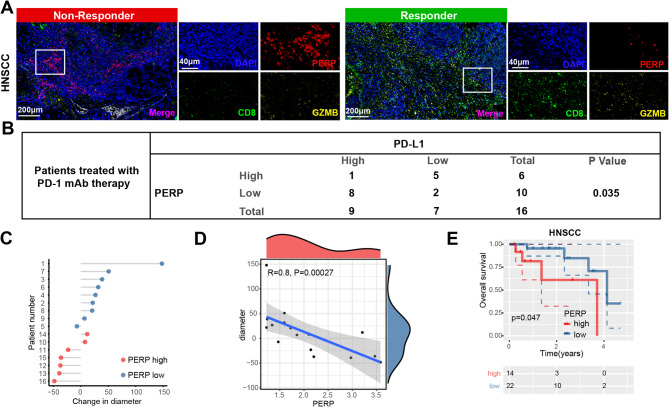
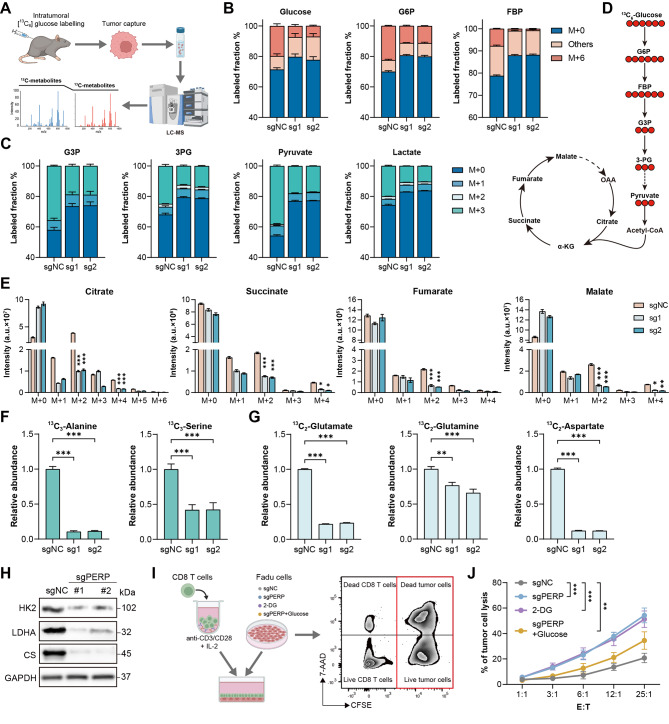
Results: PERP exhibits elevated expression in the majority of cancer types and impedes immune cell infiltration as well as immune checkpoint reactivity in pan-cancer. We confirmed that PERP can promote tumor progression by tumor cell proliferation, scratch and transwell experiments. Meanwhile, the absence of PERP restricts the flux of 13C6-glucose into glycolysis and the tricarboxylic acid (TCA) cycle. Importantly, the deficiency of PERP enhances the in vivo anti-tumor efficacy of PD1 monoclonal antibodies. In addition, low PERP expression is highly correlated with the response of head and neck squamous cell carcinoma (HNSCC) patients to immunotherapy.

Conclusions: PERP represents a promising predictive/diagnostic biomarker and therapeutic target for HNSCC patients.

Keywords: Head and neck squamous cell carcinoma; PD1; PERP; Prognosis; Tumor microenvironment.


Conflict of interest statement

Declarations. Ethics approval and consent to participate: Experiments involving clinical samples were carried out in compliance with the approved protocol of the Clinical Research Ethics Committee of the Xiangya Hospital Central South University (protocol 2023030315). Experiments involving animals were approved by the Institutional Review Committee of Xiangya Hospital, Central South University (protocol XY20240711004). Consent for publication: Not applicable. Competing interests: The authors declare no competing interests.

Figures

Fig. 1
Fig. 1
The role of PERP in anti-tumor immune and metabolic pathways. (A) Correlation between PERP expression and T cell score of HNSCC. (B) Correlation between PERP expression and gene expression related to pan-cancer T cell score. (C) Differential genes based on PERP expression are significantly enriched in metabolic and immune-related pathways. (D) Metabolic pathways are significantly associated with PERP expression. (E) Survival-related metabolic pathways are significantly related to PERP expression
Fig. 2
Fig. 2
Identification of PERP regulatory gene clusters for immunity, treatment, and prognosis in HNSCC. (A) The HNSCC patients were stratified into 3 clusters based on the consensus clustering matrix (k = 3). (B) Survival curves of three clusters forecast the survival of the patient. (C) Heat maps of chemokines in three clusters. (D) Heat maps of immune cell markers in three clusters. (E) Heat maps of drugbank reactivity in three clusters
Fig. 3
Fig. 3
PERP inhibition alleviates tumor growth in vitro. (A) Basic expression of PERP in various head and neck tumor cell lines. (B and C) FaDu and Meer cells were transfected with sgPERP or negative control (sgNC), PERP was overexpressed in HN8 cells, PERP expression was analyzed by (B) Western blot and (C) quantified. (D-F) Proliferation of sgPERP or OE-PERP was measured by MTS assay at the indicated time points in FaDu, Meer and HN8 cells. (G-L) Cell scratch assay was used to detect the migration ability of different cell lines. (M-O) The invasive ability of different cell lines was detected by transwell assay p values were calculated using one-way ANOVA and Dunnett’s multiple comparison test. Results are presented as mean ± SEM, n = 3. Abbreviations, *p < 0.05, **p < 0.01, ***p < 0.001
Fig. 4
Fig. 4
In immune-competent mouse models, inhibition of PERP induces antitumor immunity, thereby attenuating tumor growth (A) subcutaneous tumor images of the Meer cells. (B and C) Summary of volume and weight data of Meer tumors harvested after euthanizing the mice. (D-G) FACS of CD8 + cells, CD8 + in CD3 + cells and GZMB + in CD8 + cells from sgPERP or sgNC Meer xenografts and quantification. (H) GSEA of the indicated pathways. (I) Western blotting analysis of the protein levels of PD-L1 and p65 in whole cell lysates and nuclear fractions in Fadu cells expressing sgNC and sgPERP. (J) Western blotting analysis of the protein levels of PD-L1 and p65 in Fadu cells expressing sgNC and sgPERP. Cells were treated with the NF-κB agonist TNFα (100 nM) or vehicle control 6 h before sample collection. (K) Western blotting analysis of the protein levels of PD-L1 and p65 in Fadu cells expressing EV and OE-PERP. Cells were treated with the NF-κB inhibitor BAY11-7082 (5µM) or vehicle control 6 h before sample collection. (L) Fadu cells were harvested for reciprocal co-IP of PERP and p65. Data were presented as the mean ± SD (n = 5), statistical significance was determined by one-way ANOVA. *P < 0.05; **P < 0.01; ***P < 0.001; ns, not significant
Fig. 5
Fig. 5
Improved In Vivo Anti-tumor Effect of PD-1 Blockade and sgPERP Cotreatment. (A) A schematic view of the treatment plan. (B and C) Summary of volume and weight data of Meer tumors harvested after euthanizing the mice. (D) FACS of CD8 + in CD3 + TILs from different groups Meer xenografts and quantification. (E) FACS of GZMB + in CD8 + cells from different groups Meer xenografts and quantification. (F) FACS of PD-1 + in CD8 + cells from different groups Meer xenografts and quantification. (G) FACS of PD-1 + in lymph nodes CD8 + cells from different groups Mouse and quantification. (H) A schematic view of the treatment plan. (I and J) Summary of volume and weight data of 4T1 tumors harvested after euthanizing the mice. Data were presented as the mean ± SD (n = 5), statistical significance was determined by one-way ANOVA. *P < 0.05; **P < 0.01; ***P < 0.001; ns, not significant
Fig. 6
Fig. 6
PERP exhibits a negative correlation with PD-L1 expression in patient samples from HNSCC. (A) Two HNSCC (Nivolumab) patients who underwent PD-1 monoclonal antibody therapy, one showing a positive response (Pt.7) and the other a non-responsive case (Pt.15), were examined. mIHC was performed using antibodies against PERP, CD8, and GZMB in the tumor tissues. Scale bars, 200 μm and 40 μm, respectively. (B) The expression of PERP is inversely correlated with the expression levels of PD-L1 in HNSCC. (C) The difference in tumor diameter for all patients, where those with increased tumor diameter are colored in red. (D) Quantitative correlation between the change in tumor diameter and PERP expression levels. (E) Kaplan-Meier survival curves illustrating the correlation between PERP expression levels and OS in HNSCC patients
Fig. 7
Fig. 7
PERP deficiency restricts 13C6-glucose flux into glycolysis and the TCA cycle. (A) Schematic depicting the workflow of sample processing and LC-MS. (B, C) Isotope tracing showing the percentage of glucose, G6P, FBP, G3P, 3-PG, pyruvate and lactate in Meer tumors collected from sgPERP and sgNC groups. (D) Schematic depicting the contribution of 13C6-glucose to glycolysis and the TCA cycle. (E) Fraction of 13C6-labeled TCA cycle intermediates (citrate, succinate, fumarate, and malate) in Meer mEER tumors collected from sgPERP and sgNC groups. (F, G) Relative intensity of 13C6-glucose-derived amino acids in Meer tumors collected from sgPERP and sgNC groups. (H) Western blot analysis of glycolytic enzymes (HK2, LDHA) and TCA cycle enzyme (CS) in sgNC versus sgPERP #1 and #2 Fadu cells. GAPDH served as loading control. (I) Experimental design for in vitro CD8 + T cell cytotoxicity assay: Activated human CD8 T cells were co-cultured with CFSE-labeled Fadu cells (sgNC, sgPERP, 2-DG-treated, or sgPERP with 10 mM glucose supplementation) at indicated effector-to-target (E: T) ratios for 24 h. (J) Quantification of tumor cell death by flow cytometry (CFSE + 7-AAD + population) at different E: T ratios. Data are presented as mean ± SEM (n = 6). Statistical significance was determined using one-way ANOVA. *P < 0.05; **P < 0.01; ***P < 0.001; ns, not significant

References

    1. Fu T, Dai LJ, Wu SY, Xiao Y, Ma D, Jiang YZ, Shao ZM. Spatial architecture of the immune microenvironment orchestrates tumor immunity and therapeutic response. J Hematol Oncol. 2021;14(1):98. - PMC - PubMed
    1. Kato K, Cho BC, Takahashi M, Okada M, Lin CY, Chin K, Kadowaki S, Ahn MJ, Hamamoto Y, Doki Y, et al. Nivolumab versus chemotherapy in patients with advanced oesophageal squamous cell carcinoma refractory or intolerant to previous chemotherapy (ATTRACTION-3): a multicentre, randomised, open-label, phase 3 trial. Lancet Oncol. 2019;20(11):1506–17. - PubMed
    1. Larkin J, Chiarion-Sileni V, Gonzalez R, Grob JJ, Rutkowski P, Lao CD, Cowey CL, Schadendorf D, Wagstaff J, Dummer R, et al. Five-Year survival with combined nivolumab and ipilimumab in advanced melanoma. N Engl J Med. 2019;381(16):1535–46. - PubMed
    1. Traeger RS, Woodcock J, Tan S, Shi Z, Vasquez-Vivar J. Tetrahydrobiopterin as a rheostat of cell resistance to oxidant injury. Redox Biol. 2025;79:103447. - PMC - PubMed
    1. Faubert B, Solmonson A, DeBerardinis RJ. Metabolic reprogramming and cancer progression. Science 2020, 368(6487). - PMC - PubMed

MeSH terms

Substances

LinkOut - more resources