. 2025 Sep;23(9):3540-3560.
doi: 10.1111/pbi.70149. Epub 2025 Jun 8.

Modulating the activity of the APC/C regulator SISAMBA improves the sugar and antioxidant content of tomato fruits

Affiliations

Modulating the activity of the APC/C regulator SISAMBA improves the sugar and antioxidant content of tomato fruits

Perla Novais de Oliveira et al. Plant Biotechnol J. 2025 Sep.

Abstract

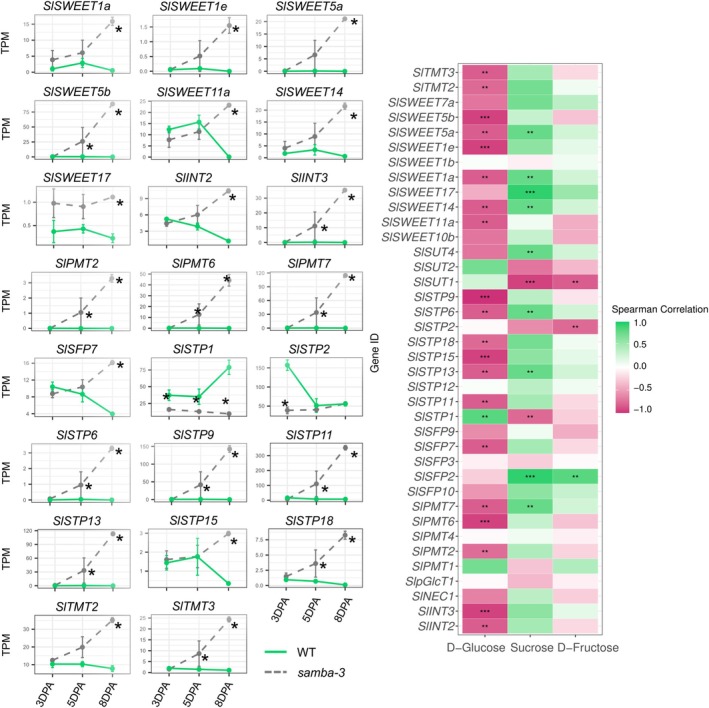
The Anaphase-Promoting Complex/Cyclosome (APC/C) is an E3 ubiquitin ligase that plays a crucial role in ubiquitin-dependent proteolysis of key cell cycle regulators, which is completed by the 26S proteasome. Previously, SAMBA, a plant-specific regulator of the APC/C, was identified in Arabidopsis as a critical factor controlling organ size through the regulation of cell proliferation. Here, by assessing its role in the crop tomato (Solanum lycopersicum), we confirm that SAMBA is a conserved APC/C regulator in plants and shows additional roles, including the modulation of fruit shape and changes in sugar metabolism. Two slsamba genome-edited lines were produced and characterized, and showed delayed growth, reduced plant size, and altered fruit morphology, which were linked to changes in cell division and expansion. Notably, untargeted metabolomics revealed altered flavonoid profiles, along with elevated Brix values in the fruits, indicating a sweeter taste. Accordingly, transcriptomics uncovered a change in temporal gene expression gradients during early fruit development, correlating with the alterations in sugar metabolism and revealing changes in cell wall biosynthesis genes. This study provides the first evidence of SAMBA's role in regulating fruit development, metabolic content, and ultimately, quality. These important findings offer potential applications for improving the nutritional quality and overall performance of tomatoes.

Keywords: APC/C; CRISPR/Ca9; fruit development; metabolic changes; tomato; transcriptomic analysis.


Conflict of interest statement

The authors have no conflict of interest to declare.

Figures

Figure 1
Figure 1
Phylogenetic relationships and architecture of conserved motifs in the SISAMBA protein and spatio‐temporal expression of SlSAMBA in tomato cv. Micro‐Tom. (a) Phylogenetic tree of SAMBA proteins from Solanum lycopersicum, Ricinus communis, Vitis vinifera, Arabidopsis thaliana, Populus trichocarpa, Sorghum bicolour, Oryza sativa, Picea sitchensis, Zea mays, and Nicotiana tabacum constructed using IQ‐Tree v.1.6.9. Three putative conserved motifs (SHR1, LCR, and SHR2) described by Eloy et al. (2012) were identified in most SAMBA homologues. Their location and motif consensus sequences are shown. (b) Multiple sequence alignment of the S. lycopersicum Solyc08g076580.2.1 gene (SAMBA‐homologue) was performed using Clustal X version 2.1 with default parameters (Thompson et al., 1997). (c) Tissue‐specific expression profile of SlSAMBA. Data was generated by qRT‐PCR, using β‐actin as an internal control. Root (30‐day‐old plants), 1st leaf, and 5th leaf in logarithmic scale, with 26 to 500 on the x‐axis omitted; 20 days before anthesis (−20 DBA), −1 DBA, flowers at the pre‐anthesis stage, 1 day before anthesis; and 0 DPA, the day of anthesis; 10 DPA, 10 days post‐anthesis, 20 DPA, 20 days post‐anthesis; and RR, red ripe fruit. (d) SISAMBA expression was high in the anther, pistil, and pollen grains. Scale bar = anther and pistil (1 mm), pollen grains (50 μm), and fruits (2 mm). (e) Flowers at anthesis, i.e. 0 days post‐anthesis (0 DPA), and fruits at 5 DPA, 10 DPA, and 15 DPA, as well as at different maturity stages, i.e. light red (LR), and red ripe (RR). The SISAMBA expression is higher at the early stages of fruit development.
Figure 2
Figure 2
Phenotypic effects of slsamba gene editing on tomato plant development. (a) Representative 40‐day‐old slsamba (#3 and #27) and WT plants grown in soil. The edited lines are smaller compared to the WT. (b, c) Height of the first inflorescence and stem diameter of WT and slsamba mutants. Data are means ± SEM (n = 12). (d, e) Morphology of the 5th leaf in WT and slsamba and total leaflet area of one leaf were measured 1 month after sowing. Data are means ± SEM (n = 21). (f, g) Flowers at anthesis in WT and slsamba were observed by stereo microscopy (SMZ 1500 increased 7.5×). Slsamba mutants have a reduced average anther length/width ratio at anthesis. Data are means ± SEM (n = 21). (h) Mature fruits of WT and slsamba plants. (i) Fruit shape index and (j) weight of the third fruit per inflorescence for WT and slsamba at different stages. Data are means ± SEM (n = 24). Significant differences (ANOVA followed by Dunnett's test) are indicated by asterisks (*P < 0.05 and **P < 0.01).
Figure 3
Figure 3
Phenotypic effects of the slsamba mutation on female and male gametophytes. (a) Seed number per fruit from spontaneous self‐pollinations (♀WT × ♂WT/ ♀slsamba‐3 × ♂slsamba‐3). (b, c) Pistil phenotypes of WT and slsamba plants; scale bar = 2 mm. The edited lines have shorter stigma width and style length compared to the WT, but the ovary length is not statistically different. Data are means ± SEM (n = 21). (d) Number of locules in WT and slsamba mutants. Locule number quantifications are represented by stacked bar plots (n = 8 plants). (e) Electron micrographs of WT and slsamba pollen grains (scale bar = 5 μm). (f, g) Pollen viability [(number of viable pollen grains)/(number of total pollen grains counted × 100)] and pollen germination [(number of germinated pollen grains)/(number of total pollen grains counted × 100)]. Results are expressed as mean values ± SE, considering 10 optical fields randomly selected. (h) Total fruit set and seeded fruits from WT or slsamba emasculated flowers crosses (♀WT × ♂WT/♀slsamba × ♂slsamba) and back‐crosses (♀slsamba × ♂WT/ ♀WT × ♂slsamba). (i) Representative longitudinal sections of WT, slsamba, and ♂WT x ♀slsamba ripe fruits, where seeds can be observed more frequently in WT and ♂WT x ♀slsamba but not in the mutant. C, columella; S, seed; P, pericarp; LG, locular gel; scale bar = 2 mm. (j) Histological analysis of longitudinal sections of ovaries at −6 days before anthesis (DBA) of WT and slsamba mutants; Bars = 100 μM. (k) The average ovary diameter, ovary length, and ovary shape index were calculated using ImageJ. Data are means ± SEM (n = 9). Significant differences (ANOVA followed by Dunnett's t test) are shown by asterisks (*P < 0.05 and **P < 0.01).
Figure 4
Figure 4
Cell number and cell size alterations in slsamba fruits. (a) Morphology of fruits and microscopic observations of wild‐type Micro‐Tom (WT) and slsamba mesocarp cells (#3 and #27) at 0 (Bar = 300 μM), 10 (Bar = 20 μM), 15 (Bar = 20 μM), and 30 days post‐anthesis (DPA) (Bar = 200 μM). (b) Pericarp thickness, (c) number of cell layers in the pericarp, (d) average cell size, and (e) cell numbers per area in the mesocarp regions in the WT and slsamba mutants. Data are means ± SEM (n = 9). Significant differences (ANOVA followed by Dunnett's t test) are shown by asterisks (*P < 0.05 and **P < 0.01).
Figure 5
Figure 5
Primary metabolites were significantly altered in the fruits of slsamba mutants compared to the WT. (a) Relative metabolite quantification was performed by gas chromatography coupled with tandem mass spectrometry (GC–MS/MS) using fruits from individual homozygous plants of lines 3 and 27 and WT plants harvested at early fruit development (3, 5 and 8 days post‐anthesis). Metabolites were identified based on receiver operating characteristic (ROC) curves using log and auto‐scaling normalized data on the MetaboAnalyst platform 6.0. Data are means ± SD (n = 4–6). Grey and green lines indicate lines 3 and 27, respectively. (b) Primary metabolites were significantly altered in red ripe fruits (52 DPA) of slsamba mutants compared to the WT. Data are means ± SD (n = 7). Significant differences (one‐way ANOVA, post hoc paired t‐test) between the WT and each mutant line are indicated by asterisks (*P < 0.05 and **P < 0.01).
Figure 6
Figure 6
Specialized metabolites were significantly altered in the fruits of slsamba mutants compared to the WT. (a) Relative metabolite quantification was performed by liquid chromatography coupled to tandem mass spectrometry (LC–MS/MS) using fruits from individual homozygous plants of lines 3 and 27 and WT plants harvested at early fruit stages (3, 5 and 8 days post‐anthesis). Metabolites were identified based on elution time, molecular weight, and MS/MS fragmentation patterns in our databases (Data S2) and were normalized using log and auto‐scaling data on the MetaboAnalyst platform 6.0. Data are means ± SD (n = 4–6). Grey and green lines indicate lines 3 and 27, respectively. (b) Quantification of specialized metabolites significantly altered in red ripe fruits (52 DPA) of sIsamba mutants compared to the WT. Data are means ± SD (n = 6–7). Significant differences (one‐way ANOVA, post hoc paired t‐test) between the WT and each mutant line are indicated by asterisks (*P < 0.05 and **P < 0.01).
Figure 7
Figure 7
Over‐representation analysis of DEGs in MapMan Bins. Enriched top‐level MapMan bins are shown on the left, while specific sub‐bins are detailed below each time point. Over‐representation was determined using the hypergeometric distribution of DEG lists against the background genes (all genes expressed in the analysed samples). Only enrichments with Bonferroni‐adjusted P‐values <0.05 are portrayed. Up‐ and down‐regulated genes were analysed separately. Green boxes correspond to an over‐represented bin of up‐regulated genes; red boxes correspond to a bin enriched in down‐regulated genes; yellow boxes represent bins over‐represented in both up‐ and down‐regulated genes. Green circles represent up‐regulated bins; red circles represent down‐regulated bins. The complete table with the enrichment analysis results is available in Data S3.
Figure 8
Figure 8
Expression profiles of sugar transporters and their correlation with different sugars. Expression profiles of sugar transporters significantly correlated with different sugars (|⍴| > 0.75). Expression values correspond to normalized TPM values. * = Time point with significant differential expression (adjusted P‐value <0.05). The heatmap shows Spearman correlation values (⍴) above 0.75 and below −0.75 marked by ‘**’, while values above 0.9 and below −0.9 are marked by ‘***’.

References

    1. Alfieri, C. , Chang, L. , Zhang, Z. , Yang, J. , Maslen, S. , Skehel, M. and Barford, D. (2016) Molecular basis of APC/C regulation by the spindle assembly checkpoint. Nature 536, 431–436. - PMC - PubMed
    1. Alfieri, C. , Zhang, S. and Barford, D. (2017) Visualizing the complex functions and mechanisms of the anaphase promoting complex/cyclosome (APC/C). Open Biol. 7, 170204. - PMC - PubMed
    1. Arora, D. , Abel, N.B. , Liu, C. , Van Damme, P. , Yperman, K. , Eeckhout, D. , Vu, L.D. et al. (2020) Establishment of Proximity‐Dependent Biotinylation Approaches in Different Plant Model Systems. Plant Cell 32, 3388–3407. - PMC - PubMed
    1. Baker, D.J. , Dawlaty, M.M. , Galardy, P. and van Deursen, J.M. (2007) Mitotic regulation of the anaphase‐promoting complex. Cell Mol. Life Sci. 64, 589–600. - PMC - PubMed
    1. Beauvoit, B.P. , Colombié, S. , Monier, A. , Andrieu, M.H. , Biais, B. , Bénard, C. , Chéniclet, C. et al. (2014) Model‐assisted analysis of sugar metabolism throughout tomato fruit development reveals enzyme and carrier properties in relation to vacuole expansion. Plant Cell 26, 3224–3242. - PMC - PubMed

MeSH terms

LinkOut - more resources