. 2025 Jun 24;44(6):115792.
doi: 10.1016/j.celrep.2025.115792. Epub 2025 Jun 7.

Cholesterol metabolism regulated by CAMKK2-CREB signaling promotes castration-resistant prostate cancer

Affiliations

Cholesterol metabolism regulated by CAMKK2-CREB signaling promotes castration-resistant prostate cancer

Chenchu Lin et al. Cell Rep. .

Abstract

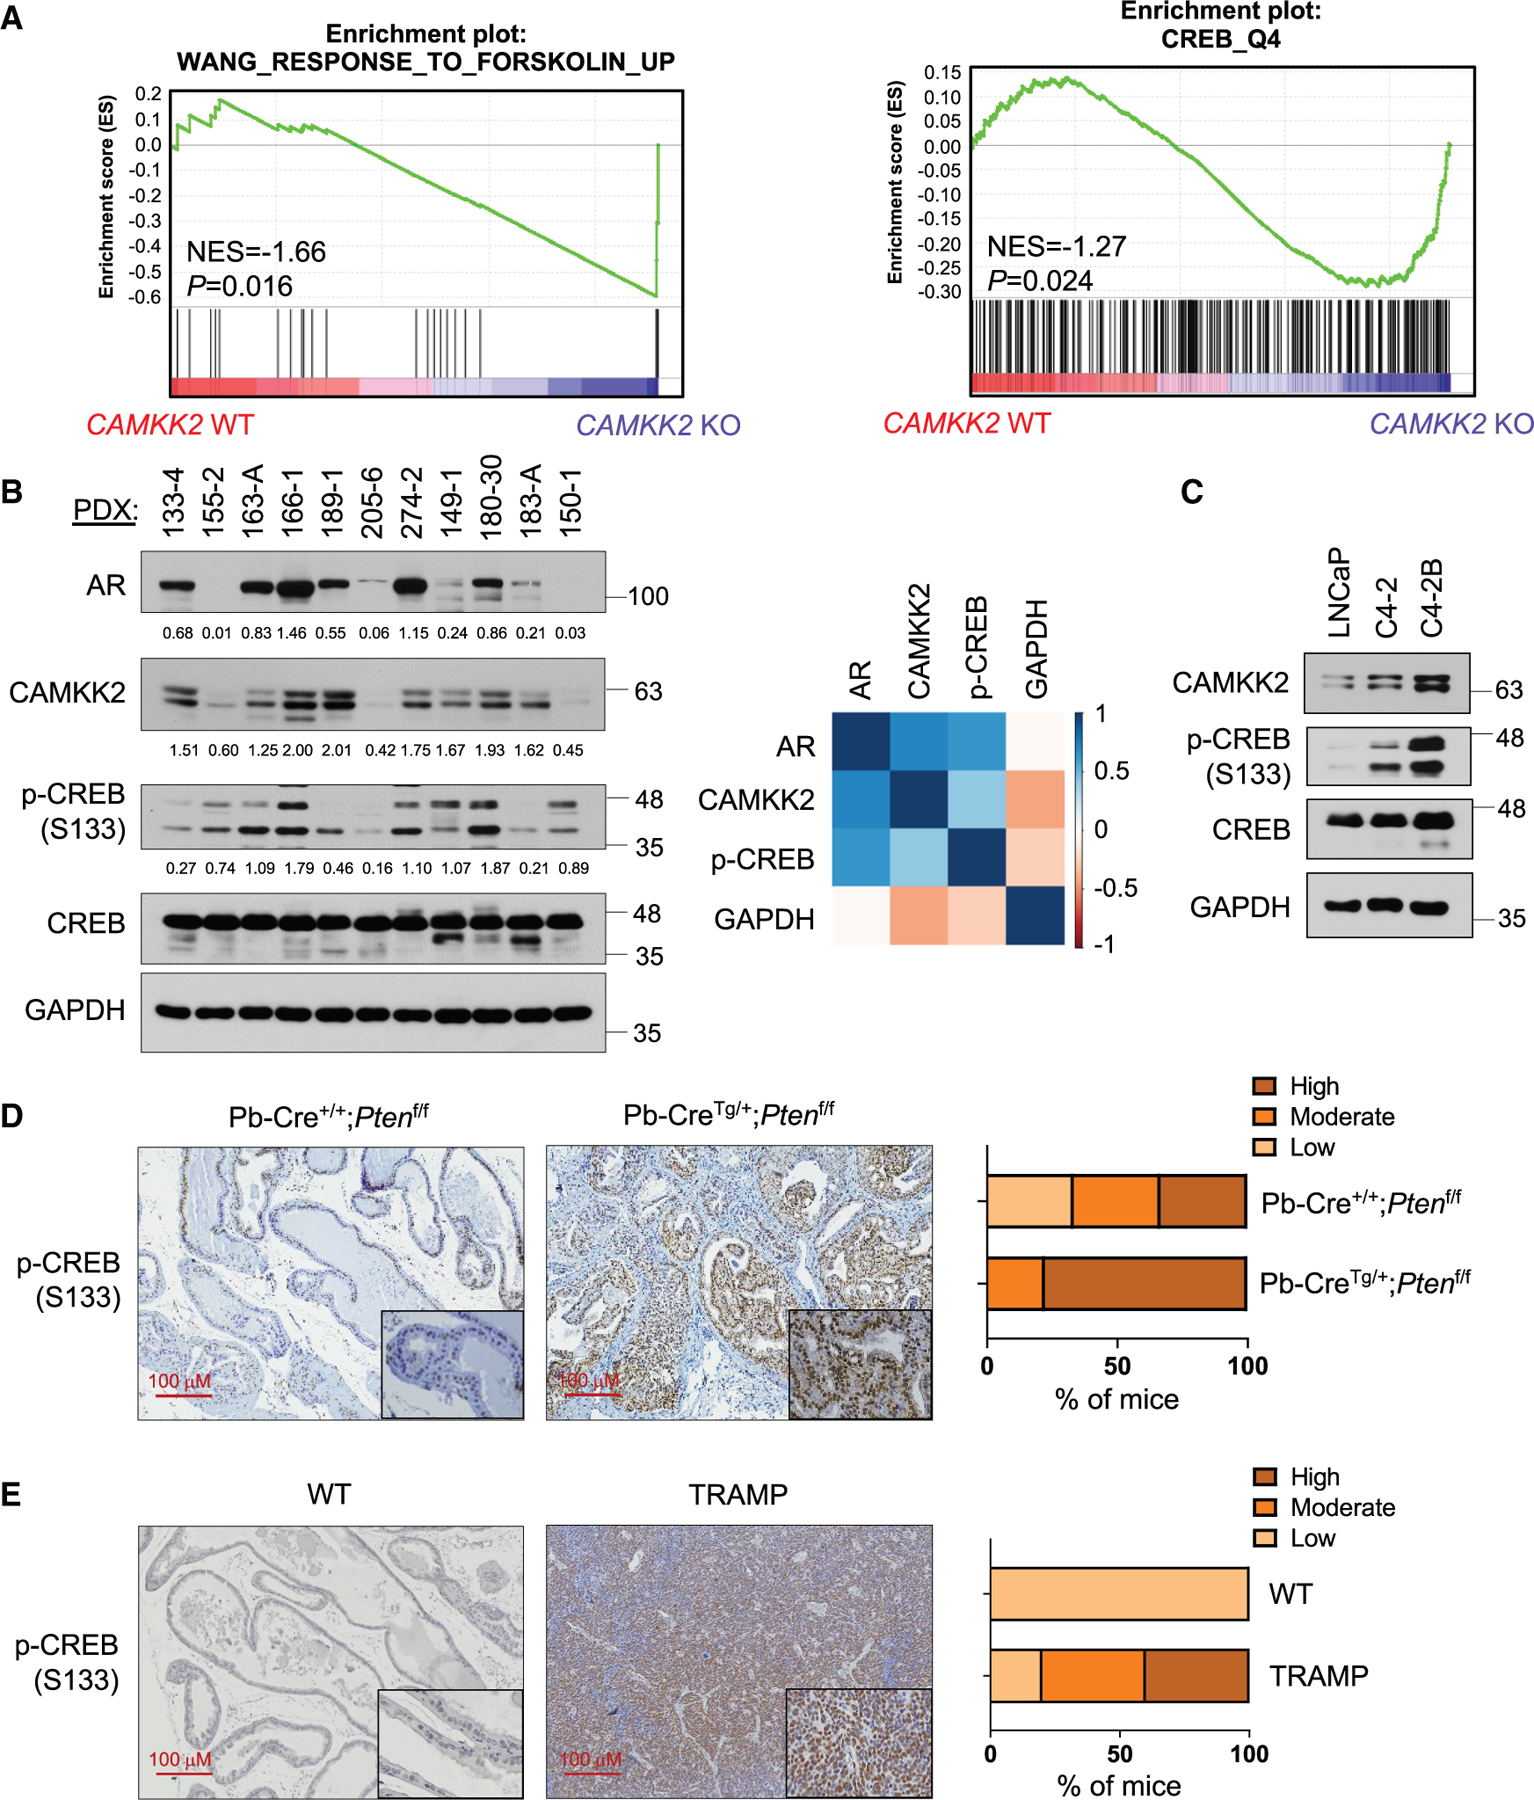
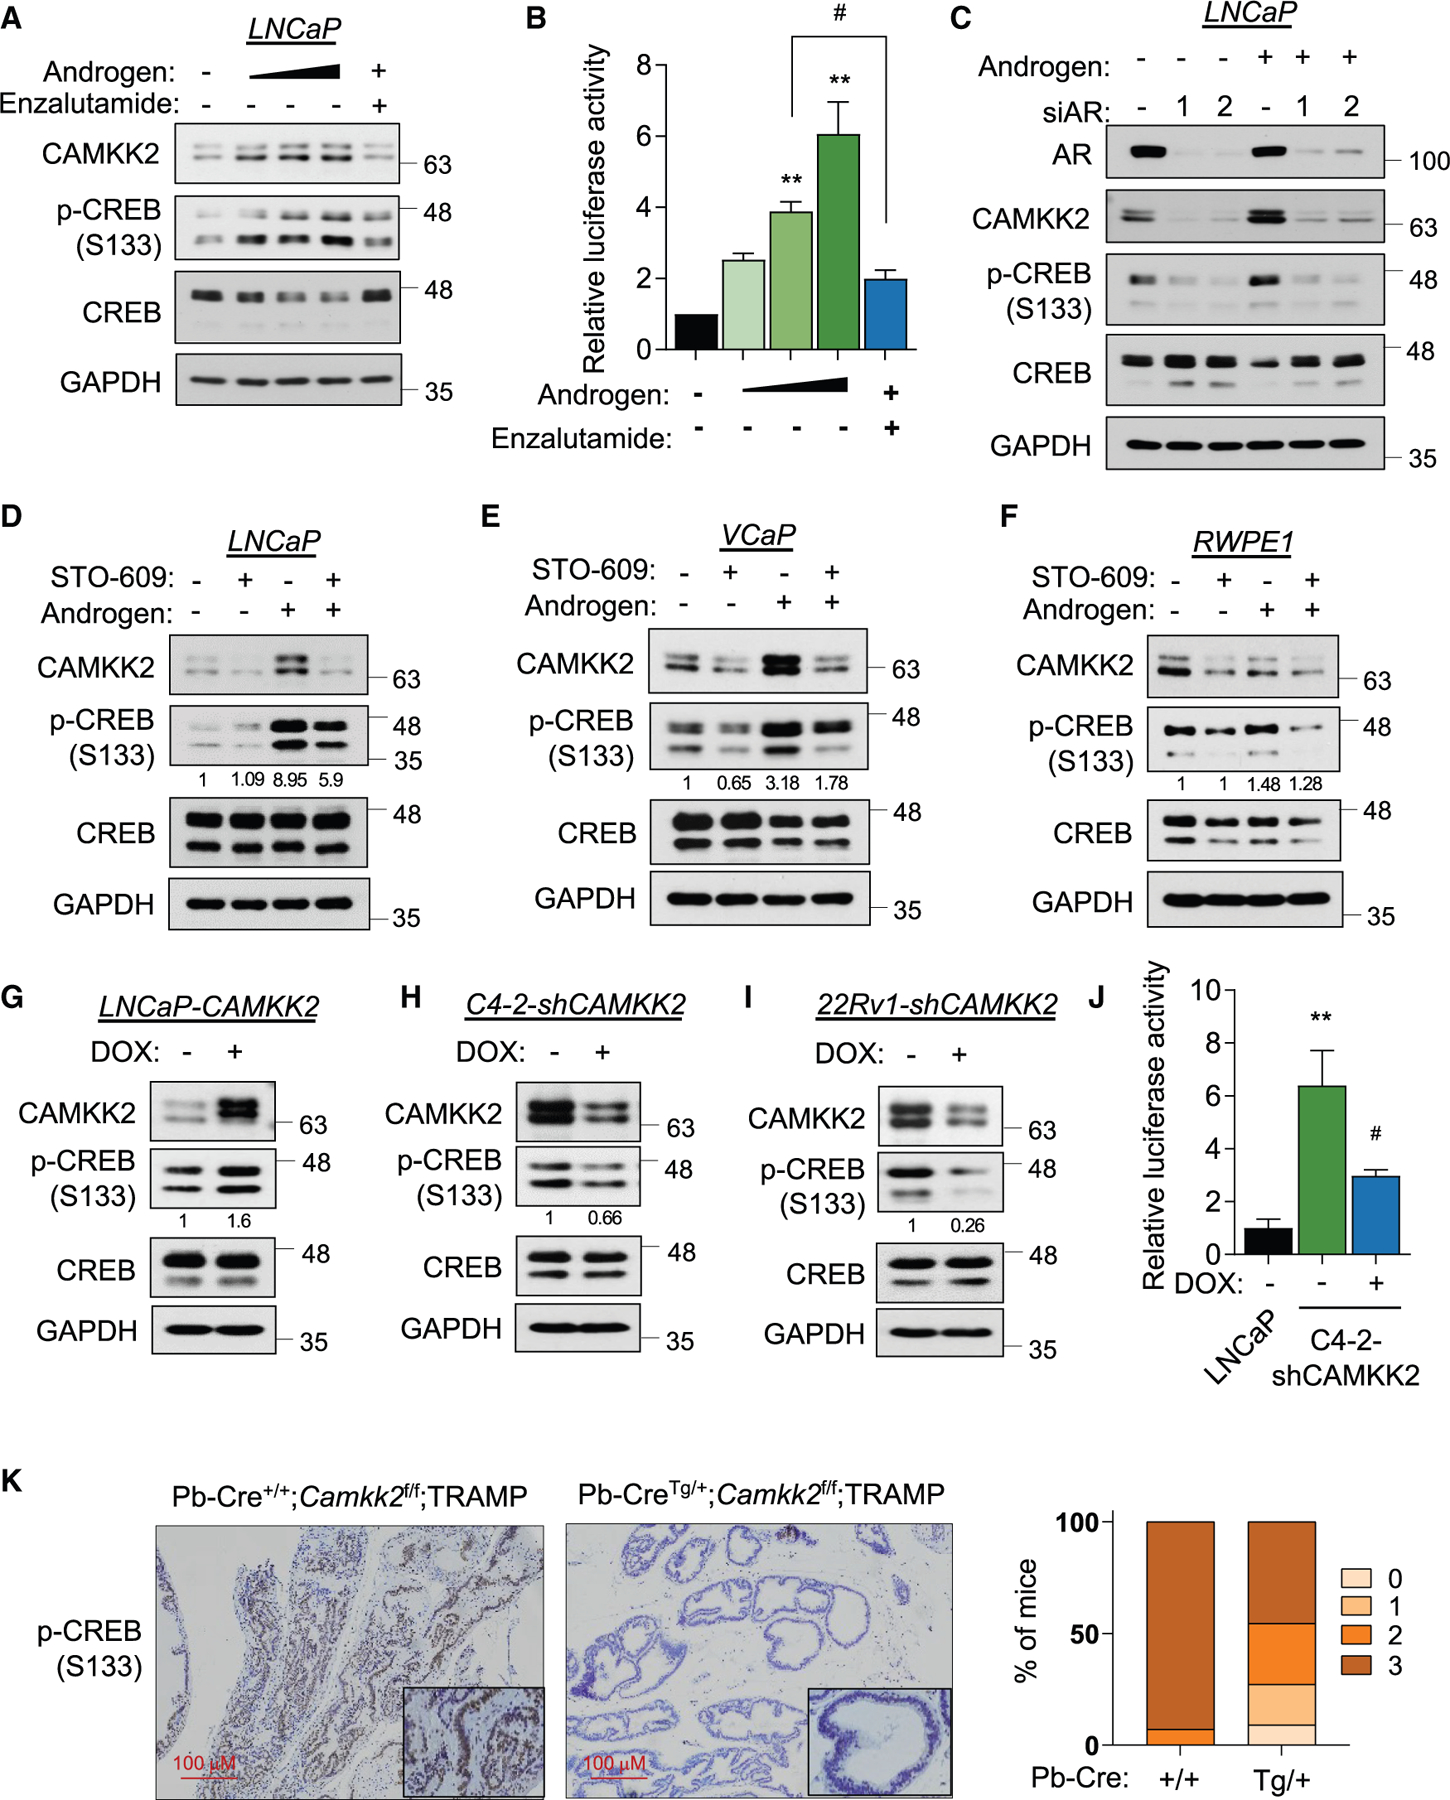
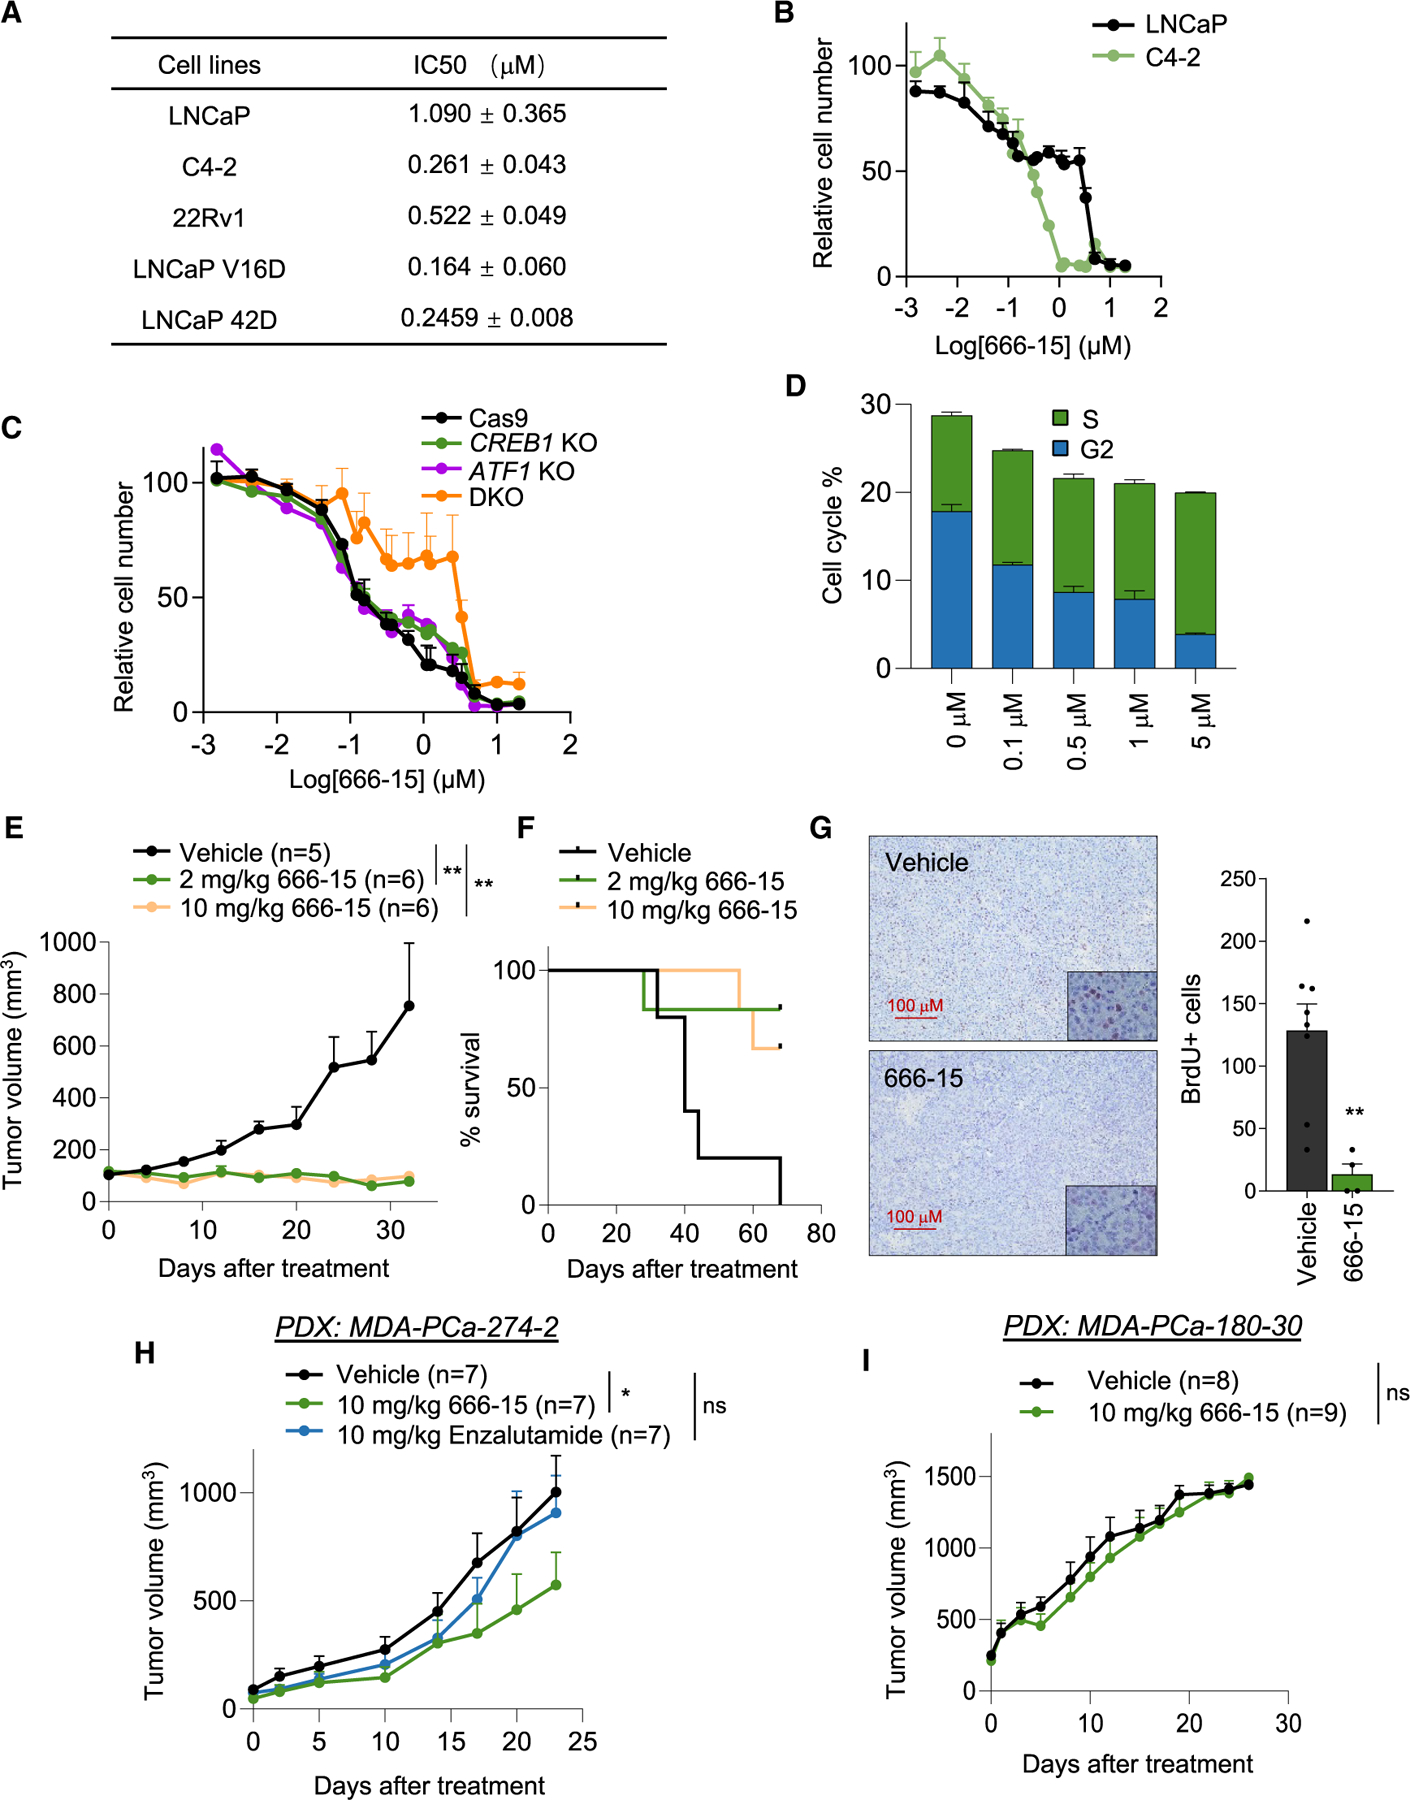
Castration-resistant prostate cancer (CRPC) remains an incurable disease in need of improved treatments. CAMKK2 is an emerging therapeutic target whose oncogenic effects in prostate cancer have, to date, been largely attributed to its activation of AMP-activated protein kinase (AMPK). Here, we demonstrate that CAMKK2 promotes prostate cancer growth through an alternative downstream pathway involving CAMKI and CREB. Unbiased transcriptomics identify CREB-mediated transcription as a CAMKK2-regulated process, findings that we validate using diverse molecular, genetic, and pharmacological approaches in vitro and in vivo. CAMKK2 promotes CREB phosphorylation/activation through CAMKIα independently of AMPK, CAMKIV, or other CAMKI isoforms. Functionally, the CREB family members CREB1 and ATF1 exhibit close redundancy, necessitating co-targeting for optimal anti-tumor efficacy. An inhibitor of CREB1/ATF1 blocks CRPC with minimal side effects. Mechanistically, CAMKK2 and CREB increase CRPC growth through augmenting cholesterol metabolism. Together, these findings identify an oncogenic pathway that could be exploited for the treatment of CRPC.

Keywords: AMPK; CAMKI; CAMKK2; CP: Cancer; CP: Metabolism; CREB; androgen receptor; cholesterol; metabolism; prostate cancer.


Conflict of interest statement

Declaration of interests D.E.F. has received research funding from GTx, Inc, and has a familial relationship with March Biosciences, Biocity Biopharmaceuticals, and Barricade Therapeutics. D.E.F. has also been issued a patent on CAMKK2 as a target in cancer (USP 9999620; EP 2606130).

Figures

Figure 1.
Figure 1.. CREB phosphorylation and activity correlate with CAMKK2 and disease progression in diverse preclinical prostate cancer cell and animal models
(A) GSEA analysis of cAMP pathway and CREB motif signatures along the stat score rank of transcripts expressed in CAMKK2 KO compared with Cas9 control (WT) C4-2 cells. (B) Immunoblot and densitometry (left) and densitometry Pearson correlation (right) analysis of AR, CAMMK2, and p-CREB (Ser133) levels in 11 prostate cancer PDX models. (C) Immunoblot analysis of LNCaP and LNCaP-derived CRPC cells (C4-2 and C4-2B). (D) Immunohistochemical (IHC) staining of p-CREB (representative in dissected prostate lobes: left, 100×; quantification: right) in 40-week-old Pb-Cre4+/+;Ptenf/f (n = 3) and Pb-CreTg/+;Ptenf/f (n = 3) mice. Scale bar, 100 μM. (E) IHC staining of p-CREB (representative prostate staining: left, 100×; quantification: right) in 30-week-old WT (n = 5) and TRAMP (n = 5) mice. Scale bar, 100 μM.
Figure 2.
Figure 2.. Phosphorylation and activation of CREB is regulated by AR-CAMKK2 signaling
(A) Immunoblot analysis of LNCaP cells treated with vehicle or the synthetic androgen R1881 alone (100 pM, 1 nM, and 10 nM) or in combination (1 nM) with enzalutamide (10 μM, 1-h pretreatment) for 72 h. (B) CRE-luciferase activity of pGL4.23-CRE-luc expressed LNCaP cells were treated with vehicle or R1881 alone or in combination with enzalutamide for 72 h. Data are represented as mean ± SEM. One-way ANOVA; **p < 0.01, compared with vehicle. #p < 0.05. (C) Immunoblot analysis of LNCaP siRNA control or AR treated ±10 nM R1881 for 72 h. (D–F) Immunoblot analysis of LNCaP (D), VCaP (E), and RWPE1 (F) cells treated ± STO-609 and ± R1881 for 72 h. (G) Immunoblot analysis of inducible CAMKK2 overexpression LNCaP cells treated ± 20 nM doxycycline (DOX) for 48 h. (H and I) Immunoblot analysis of inducible CAMKK2 knockdown C4-2 (H) and 22Rv1 (I) cells treated with 800 nM doxycycline for 72 h. (J) CRE-luciferase activity of LNCaP, C4-2, and C4-2 shCAMKK2. Data are represented as mean ± SEM. One-way ANOVA; **p < 0.01, C4-2 compared with LNCaP. #p < 0.05, C4-2 shCAMKK2 compared with C4-2. (K) IHC staining of p-CREB (representative prostate staining: left, 100×; quantification: right) in 15-week-old Pb-Cre4+/+;Camkk2f/f;TRAMPTg/+ (n = 5) and Pb-CreTg/+;Camkk2f/f;TRAMPTg/+ (n = 6) mice. Scale bar, 100 μM. All C4-2 and 22Rv1 experiments were done in the absence of androgens. For (D)–(I), average densitometry values (n = 2) are included to quantify p-CREB levels (combined bands) normalized total CREB levels.
Figure 3.
Figure 3.. CAMKIα is the predominant kinase mediating AR-CAMKK2-induced phosphorylation and activation of CREB in prostate cancer cells
(A) Illustration of the downstream kinases of CAMKK2. (B) LNCaP cells were transfected with mock (M) or siRNAs targeting scramble control (NC) or PRKAA1 (encoding the major AMPKα catalytic subunit isoform in prostate cancer cells), and immunoblot analysis was performed on transfected cells that were treated ± 10 nM R1881 for 72 h. (C and D) LNCaP (C) and VCaP (D) cells were transfected with siRNAs targeting mock (M), scramble control (NC), or CAMKIα and immunoblot analysis of transfected cells that were treated ±10 nM R1881 for 72 h. (E) C4-2 (left) and 22Rv1 (right) cells were transfected with siRNAs targeting mock (M), scramble control (NC), or CAMKIα and subjected to immunoblot analysis after 72 h. C4-2 and 22Rv1 experiments were done in the absence of androgens. (F) CRE-luciferase activity of LNCaP cells treated with control (NC) or siCAMK1α and vehicle or R1881 (10 nM) for 72 h. Data are represented as mean ± SEM. One-way ANOVA; **p < 0.01, compared with NC + R1881. *p < 0.05, compared with NC + R1881.
Figure 4.
Figure 4.. CREB1 is required for prostate cancer cell growth and CRPC tumorigenesis
(A–C) Cell growth (top) and immunoblot analysis (bottom) of (A) shCREB1 knockdown LNCaP cells following 7 days of doxycycline (DOX) ± R1881 (androgen) treatment. Data are represented as mean ± SEM. One-way ANOVA; **p < 0.01, compared with corresponding vehicle treatment, (B) CRISPR-modified C4-2 cells with CREB1 KO clones compared with parental C4-2 and C4-2 Cas9 cells. Data are represented as mean ± SEM. One-way ANOVA; **p < 0.01, compared with Cas9 control, (C) CRISPR-modified 22Rv1 cells with CREB1 KO compared with control 22Rv1 Cas9 cells. Data are represented as mean ± SEM. One-way ANOVA; **p < 0.01, compared with Cas9 control. (DH) CRISPR-mediated CREB1 deletion in C4-2 CRPC cells (CREB1 KO) and WT or S133A CREB1 addback subclones (D, immunoblot validation) were subjected to a cell growth assay (E) or subcutaneously injected into castrated NSG mice (n = 10/group) (F–H). Data are represented as mean ± SEM. One-way ANOVAs. (E) Cell growth, **p < 0.01, ns = not significant. (F) Tumor growth, **p < 0.01, *p < 0.05. (G and H) Kaplan-Meier (KM) plot of tumor incidence (G) and survival (H). (I) Heatmap of RNA-seq data from C4-2 Cas9 control, CREB1 KO and WT, or S133A CREB1 addback cells. Genes with significant change (| LFC | ≥ 1 and padj < 0.01) comparing CREB1 KO vs. Cas9 control were considered for the clustering. The color scale bar indicates the Z score (blue, decreased expression, red, increased expression). All C4-2 and 22Rv1 experiments were done in the absence of androgens.
Figure 5.
Figure 5.. ATF1 and CREB1 exhibit functional redundancy in CRPC
(A) Alignment of human CREB1 and ATF1 proteins. Percentages denote the amino acid homology between CREB1 and ATF1 in KID and bZIP domains. (B) Cell growth curve of CRISPR-modified C4-2 cells with ATF1 KO compared with parental C4-2 and C4-2 Cas9 cells. Data are represented as mean ± SEM. One-way ANOVA; **p < 0.01. (C) Heatmaps of differentially expressed genes in CREB1 KO (left) and ATF1 KO (right) cells, compared with Cas9 control (LFC ≥ 1 and padj < 0.01). The color scale indicates the Z score (blue, decreased expression, red, increased expression). (D) Immunoblot analysis of CRISPR-mediated C4-2 cells with ATF1 KO. (E) The number of downregulated genes in CREB1 single knockout (SKO), ATF1 SKO, and CREB1/ATF1 double KO (DKO) cells. The result shows the overlap gene list from two sgRNAs. (F–I) CRISPR-mediated CREB1 SKO and CREB1/ATF1 DKO C4-2 cells were subcutaneously injected into castrated NSG mice (n = 10/group). (F) Tumor growth. Data are represented as mean ± SEM. One-way ANOVA; **p < 0.01. ##p < 0.01, compared to CREB1 KO-1. (G) KM plot of tumor incidence. Log rank test, **p < 0.01, compared with Cas9 control. ##p < 0.01, compared with CREB1 KO-1. (H) KM plot of survival. Three of the DKO mice survived more than 8 months. Log rank test, **p < 0.01, compared with Cas9 control. ##p < 0.01, compared with CREB1 KO-1. (I) IHC staining of p-CREB and BrdU for tumor samples (100×). Data are represented as mean ± SEM. One-way ANOVA; **p < 0.01, *p < 0.05, compared with Cas9 control. Scale bar, 100 μM. Experiments were done in the absence of androgens.
Figure 6.
Figure 6.. CREB inhibitor 666-15 blocks prostate cancer cell and CRPC tumor growth
(A) Indicated prostate cancer cell lines were treated with dose responses of 666-15 for 7 days and IC50 values were quantified. Data are represented as mean ± SEM. (B) Cell growth curve of LNCaP and C4-2 cells treated with 666-15. (C) Cell growth curves of Cas9 (control), CREB1 KO, ATF1 SKO, and CREB1/ATF1 DKO C4-2 cells treated with 666-15. (D) BrdU cell-cycle analysis of 666-15-treated C4-2 cells after 12 h. (E and F) Tumor growth (data are represented as mean ± SEM. One-way ANOVA; **p < 0.01) (E) and KM survival curves (F) of C4-2 xenograft mice (castrated) treated with vehicle or 666-15. (G) IHC staining of BrdU for tumor samples from (E) and (F). Left, representative staining (100×); right, quantification. Data are represented as mean ± SEM. Student’s t test; **p < 0.01, compared with vehicle treatment. Scale bar, 100 μM. (H and I) Tumor growth curves of PDX models MDA-PCa-274-2 (H) and MDA-PCa-180-30 (I) treated with vehicle, 666-15, or enzalutamide as indicated. Data are represented as mean +SEM. One-way ANOVA; *p < 0.05, ns = not significant.
Figure 7.
Figure 7.. CAMKK2-CREB signaling promotes pro-growth cholesterol metabolism in prostate cancer
(A) GSEA analysis of Hallmark_cholesterol_homeostasis in CREB1/ATF1 DKO compared with Cas9 control C4-2 cells. (B) Cholesterol metabolism is shown in the overlap of GSEA analysis of KEGG, Reactome, Hallmark, and GO gene sets. (C) Amplex red cholesterol assay of C4-2 cells after 24-h treatment with 5 μM lovastatin, 500 nM 666-15, 10 μM STO-609, or 10 mM MβCD for 30 min. Data are represented as mean ± SEM. One-way ANOVA; *p < 0.05, **p < 0.01, ***p < 0.001, ****p < 0.0001. (D and E) Amplex red cholesterol assay of WT control cells compared with (D) CREB1/ATF1 DKO cells or (E) CAMKK2 KO cells. Data are represented as mean ± SEM. One-way ANOVA; **p < 0.01, ***p < 0.001. (F) Liquid chromatography/mass spectrometry quantification of cholesterol levels in xenograft tumors described in Figure 6E. Data are represented as mean ± SEM. Student’s t test; *p < 0.05. (G) Cell growth of C4-2 cells following 5 days ± 666-15 and LDL (50 μg/mL) or HDL (50 μg/mL). Data are represented as mean ± SEM. One-way ANOVA; ****p < 0.0001, ns = not significant. (H) Cell growth of C4-2 cells following 5 days ± STO-609 and LDL or HDL. Data are represented as mean ± SEM. One-way ANOVA; ***p < 0.001, ****p < 0.0001, ns = not significant. (I) Amplex red cholesterol assay of C4-2 cells following 24 h ± 666-15 and LDL or HDL. Data are represented as mean ± SEM. One-way ANOVA; ****p < 0.0001, ns = not significant. (J) Cell growth of C4-2 WT or CREB1/ATF1 DKO cells following LDL or HDL treatment for 5 days. Data are represented as mean ± SEM. One-way ANOVA; *p < 0.05, ns = not significant. (K) Cell growth of C4-2 WT or CAMKK2 KO cells following LDL or HDL treatment for 5 days. Data are represented as mean ± SEM. One-way ANOVA; *p < 0.05, ns = not significant. Experiments were done in the absence of androgens.

References

    1. Dai C, Dehm SM, and Sharifi N (2023). Targeting the Androgen Signaling Axis in Prostate Cancer. J. Clin. Oncol 41, 4267–4278. 10.1200/JCO.23.00433. - DOI - PMC - PubMed
    1. Frigo DE, Howe MK, Wittmann BM, Brunner AM, Cushman I, Wang Q, Brown M, Means AR, and McDonnell DP (2011). CaM kinase kinase beta-mediated activation of the growth regulatory kinase AMPK is required for androgen-dependent migration of prostate cancer cells. Cancer Res 71, 528–537. 10.1158/0008-5472.CAN-10-2581. - DOI - PMC - PubMed
    1. Karacosta LG, Foster BA, Azabdaftari G, Feliciano DM, and Edelman AM (2012). A regulatory feedback loop between Ca2+/calmodulin-dependent protein kinase kinase 2 (CaMKK2) and the androgen receptor in prostate cancer progression. J. Biol. Chem 287, 24832–24843. 10.1074/jbc.M112.370783. - DOI - PMC - PubMed
    1. Massie CE, Lynch A, Ramos-Montoya A, Boren J, Stark R, Fazli L, Warren A, Scott H, Madhu B, Sharma N, et al. (2011). The androgen receptor fuels prostate cancer by regulating central metabolism and biosynthesis. EMBO J 30, 2719–2733. 10.1038/emboj.2011.158. - DOI - PMC - PubMed
    1. Sharma NL, Massie CE, Ramos-Montoya A, Zecchini V, Scott HE, Lamb AD, MacArthur S, Stark R, Warren AY, Mills IG, and Neal DE (2013). The androgen receptor induces a distinct transcriptional program in castration-resistant prostate cancer in man. Cancer Cell 23, 35–47. 10.1016/j.ccr.2012.11.010. - DOI - PubMed

MeSH terms

Substances

LinkOut - more resources