. 2025 Aug;247(3):1474-1492.
doi: 10.1111/nph.70273. Epub 2025 Jun 8.

Mountain colonization precedes shifts away from bee pollination in Melastomataceae

Affiliations

Mountain colonization precedes shifts away from bee pollination in Melastomataceae

Constantin Kopper et al. New Phytol. 2025 Aug.

Abstract

Shifts among different groups of pollinators are central in the evolution of flowering plants, yet mechanisms underlying pollinator shifts remain unclear. Environment-induced reduction in pollinator availability and hence efficiency may destabilize ancestral plant-pollinator interactions and trigger shifts to new, more efficient pollinators, but formal tests remain scarce. We used a series of phylogenetic comparative methods on 333 species of the pantropical family Melastomataceae to test whether elevation, latitude and climatic variables explain pollinator shifts and the distribution of floral traits governing pollen release. We find that shifts away from bee pollination to generalist insect and vertebrate pollination associate with occurrence in cooler and wetter mountain environments. Also, we show that mountain colonization repeatedly preceded and, hence, likely triggered shifts away from bee pollination. Furthermore, our results suggest that the evolution of floral traits (larger petals and pore sizes) facilitating pollen transfer by bees may have been critical for the initial colonization of mountains by bee-pollinated species. By identifying environments conducive to pollinator shifts, our results do not only provide a much-needed hypothesis for mechanisms underlying the evolution of different pollination systems but also confirm their validity through empirical testing. Whether environment-induced evolutionary pollinator shifts are the norm across angiosperms remains to be explored.

Keywords: Melastomataceae; abiotic environmental factors; elevational gradients; floral evolution; pollination syndromes; pollinator shifts.


Conflict of interest statement

None declared.

Figures
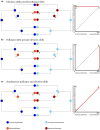
Fig. 1
Fig. 1
Schematic of the three different scenarios on the potentially interlinked nature of evolutionary pollinator shifts (left cladograms) and shifts into novel environments (right cladograms) and correlation plots for ancestral shift probability (right panels), where the x‐axis represents the ancestral node probability of having shifted pollinators and the y‐axis represents the ancestral node probability of having shifted environments. Dashed lines represent a 1 : 1 correlation, and red lines indicate expected values for ancestral nodes. (a) If environment shifts precede pollinator shifts, we expect shifts to novel environments to occur with a high probability at older nodes in a lineage's evolutionary history than pollinator shifts, and we would hence expect the observed values to lie above the 1 : 1 line in a correlation plot, with a high intercept indicating a high probability of having shifted to novel environments while still being pollinated by ancestral pollinators. (b) If pollinator shifts precede environmental shifts, we expect pollinator shifts to occur with a high probability at older nodes in the evolutionary history of a lineage than environment shifts, resulting in ancestral node values falling below the 1 : 1 correlation line and intercepts being negative, indicating a higher probability of having shifted pollinators while still being in the ancestral environment. (c) If pollinator and environment shifts occur more or less simultaneously and hence at similar nodes in the phylogeny, we expect empirical node values to fall around the 1 : 1 line in correlation plots, indicating joint shifts in environment and pollination system.
Fig. 2
Fig. 2
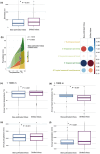
Melastomataceae species with shifted pollination systems occur at significantly higher elevations and in different biomes than bee‐pollinated species. (a) Bee‐pollinated species (blue) are more common below 1000 m while species that shifted pollinators (red) are more common above 1500 m. (b) Comparing all four pollination syndromes reveals that species that shifted to generalist pollination (green) are most common below 1000 m (like bee‐pollinated species (blue)), while all species that shifted to vertebrate pollination are significantly more common above 1500 m; boxes in (a) and (b) represent the interquartile ranges; bars inside the boxes represent the median values; whiskers represent the range and the dots represent outliers. Asterisk indicates significant differences. P values were obtained using phylogenetic ANOVA. (c, d) picture the elevation–latitude relation, showing that at higher latitudes, species that shifted away from bee pollination may occur at lower elevations. In (c), the comparison between bee‐pollinated and shifted species is shown (compare a), while (d) represents all four pollination syndromes (compare b). Density plots on top of (c, d) represent the interpolated elevational distribution; density plots on the right side of (c, d) represent the interpolated latitudinal distribution. (e) Whittaker biomes (Whittaker, 1975) are shown, with differently colored surfaces indicating different biomes (circumscribed by temperature (x‐axis) and precipitation (y‐axis)), and dots indicating species' means in temperature and precipitation. Bee‐pollinated species (blue dots) most commonly occur in tropical seasonal forests and savannas (Biome 6) and tropical rain forests (Biome 5), while shifted species (red dots) commonly occur in temperate rain forests (Biome 4) and temperate seasonal forests (Biome 3). (f) Plot of absolute standardized residuals of the chi‐squared test on the differences in biome occupation between bee‐pollinated and shifted species, with blue indicating a positive relationship, and red indicating a negative relationship. Size of the circles indicates the magnitude of the relationship; faded and small circles indicate a weak relationship. Numbers represent Whittaker biomes: 1, Tundra; 2, Boreal forest; 3, Temperate seasonal forest; 4, Temperate rain forest; 5, Tropical rain forest; 6, Tropical seasonal forest/savanna; 7, Subtropical desert; 8, Temperate grassland/desert; 9, Woodland/shrubland; Melastomataceae are absent from Biomes 1, 2 and 8.
Fig. 3
Fig. 3
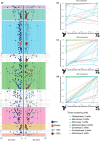
Ancestral character estimations of pollination systems (bee or shifted) and elevation showing that, generally, elevation shifts happened independently from pollinator shifts and that pollinator shifts usually happened after shifts to higher elevations. (a) The two dated phylogenetic trees show the reconstruction of pollination syndromes (left) using a MuSSE (SYM) model with nodes and tips colored as a binary trait (bee as blue and shifted as orange) and the reconstruction of elevation (right) based off a MuSSE (ARD) model, with nodes and tips colored in a binary manner with reconstructions < 1000 m summarized as ‘lowland’ and > 1000 m as ‘montane’. Pie charts at nodes represent probabilities of being bee‐pollinated (blue) or shifted (orange) and of being lowland (light blue) or montane (dark red); tip states for pollination system and elevation are also shown as pies. The seven tribes where pollinator shifts have occurred (1, 3, 4, 10, 17, 18 and 22) are highlighted with colors and correspond to colors used in Table 1 and (b–d). (b–d) The reconstructed shift proportions of pollination syndrome on the x‐axis and elevation on the y‐axis of tribes containing pollinator shifts (‘shifted tribes’) are shown; dots along the lines represent ancestral nodes descending from shifted tips (100% shift probability) to nodes with 0% shift probability (also compare Table 1); colors correspond to tribes as indicated in (a). All tribes are represented by at least two lines of the same color since all tribes contain at least two independent pollinator shifts. Following theoretical expectations from Fig. 1, a grouping of ancestral nodes along the y‐axis and lines above the 1 : 1 ratio supports elevation shifts preceding pollinator shifts, a grouping of ancestral nodes along the x‐axis and lines below the 1 : 1 ratio supports pollinator shifts preceding elevation shifts, while a grouping of nodes close to 0 and lines following the 1 : 1 ratio supports correlated evolution between elevation and pollinator shifts. (b) When all species occurring above 500 m were considered ‘montane’, 25 out of 25 ancestral nodes lie on the y‐axis and lines group above the 1 : 1 ratio. (c) When all species occurring above 1000 m were considered ‘montane’ (compare (a)), 19 out of 25 ancestral nodes lie on the y‐axis and six nodes lie close to 0. Thirteen out of 25 lines fall above the 1 : 1 ratio. (d) When choosing 1500 m as the cutoff for being ‘montane’, 10 ancestral nodes lie on the y‐axis, seven ancestral nodes lie close to 0 and 8 ancestral nodes lie along the x‐axis, and 10 out of 25 lines fall above the 1 : 1 ratio. Numbers on the very left in (a) indicate tribes: 1, Olisbeoideae; 2, Kibessieae; 3, Merianieae; 4, Miconieae; 5, Eriocnemeae; 6, Trioleneae; 7, Rupestreae; 8, Rhexieae; 9, Microlicieae; 10, Melastomateae; 11, Marcetieae; 12, Dinophoreae; 13, Dissochaeteae; 14, Cambessedesieae; 15, Stanmarkieae; 16, Cyphostyleae; 17, Sonerileae; 18, Pyxidantheae; 19, Bertolonieae; 20, Lithobieae; 21, Henrietteeae; 22, Astronieae; tribes containing species which shifted pollinators: 1, 3, 4, 10, 17, 18 and 22.
Fig. 4
Fig. 4
Bee‐pollinated species from tribes that contain pollinator shifts occur at higher elevations and under colder and wetter conditions than bee‐pollinated species from tribes without pollinator shifts. (a) Bee‐pollinated species from entirely bee‐pollinated tribes (blue) occur, on average, at 653 m, while bee‐pollinated species from tribes containing pollinator shifts (pink) occur, on average, at 820 m. (b) Comparison of Whittaker biome (Whittaker, 1975) occupation of bee‐pollinated species from shifted tribes (pink) and from nonshifted tribes (blue), showing that species from entirely bee‐pollinated tribes mostly occur in tropical rainforests (Biome 5) and savannahs (Biome 6), while bee‐pollinated species from shifted tribes are more common in temperate rainforests (Biome 4). Plot of standardized residuals of the chi‐squared test. Blue indicates a positive correlation, while red indicates a negative correlation. Size of the circles indicates the magnitude of the correlation; faded and small circles indicate a weak correlation. Colored surfaces indicate different biomes, defined by temperature (x‐axis) and precipitation (y‐axis). (c) Comparison of the annual mean temperature (°C) of bee‐pollinated species from entirely bee‐pollinated tribes and shifted tribes below 1000 m, showing that entirely bee‐pollinated tribes occupy warmer niches in lowlands. (d) Comparison of the annual mean temperature (°C) of bee‐pollinated species from entirely bee‐pollinated tribes and shifted tribes above 1000 m, showing that entirely bee‐pollinated tribes occupy colder niches in mountains. (e) Comparison of the annual precipitation (mm) of bee‐pollinated species from entirely bee‐pollinated tribes and shifted tribes below 1000 m, showing that entirely bee‐pollinated tribes occupy drier niches in lowlands. (f) Comparison of the annual precipitation (mm) of bee‐pollinated species from entirely bee‐pollinated tribes and shifted tribes above 1000 m, showing that entirely bee‐pollinated tribes occupy drier niches in mountains. Boxes represent the interquartile ranges; bars inside the boxes represent the median values; whiskers represent the range; dots represent outliers. * indicate significant differences. P values were obtained using phylogenetic t‐test. Whittaker biomes: 1, Tundra; 2, Boreal forest; 3, Temperate seasonal forest; 4, Temperate rain forest; 5, Tropical rain forest; 6, Tropical seasonal forest/savanna; 7, Subtropical desert; 8, Temperate grassland/desert; 9, Woodland/shrubland.
Fig. 5
Fig. 5
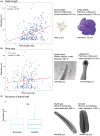
Montane bee‐pollinated Melastomataceae evolved larger flowers and pores (potentially facilitating pollen dispersal) than lowland bee‐pollinated Melastomataceae, but thecal wall structures showed no association with elevation. (a) Scatterplot of petal size on the x‐axis and elevation on the y‐axis of bee‐pollinated species. (b) Scatterplot of pore size (total pore area: π × ½ pore height × ½ pore width) on the x‐axis and elevation on the y‐axis. Red line is the regression line of the model (c) Boxplot of elevation data comparing ruminate and smooth anther wall structures of bee‐pollinated species, with no significant difference among the two groups (ns). Boxes represent the interquartile ranges; bars inside the boxes represent the median values; whiskers represent the range and dots represent outliers. P values and Z‐scores were obtained from the phylogenetic generalized linear mixed models (PGLMM), the raw data are shown in plots.

Similar articles

References

    1. Adedoja O, Kehinde T, Samways MJ. 2020. Asynchrony among insect pollinator groups and flowering plants with elevation. Scientific Reports 10: 13268. - PMC - PubMed
    1. Armbruster WS. 1985. Patterns of character divergence and the evolution of reproductive ecotypes of Dalechampia scandens (Euphorbiaceae). Evolution 39: 733–752. - PubMed
    1. Arroyo MTK, Primack R, Armesto J. 1982. Community studies in pollination ecology in the high temperate Andes of central Chile. I. Pollination mechanisms and altitudinal variation. American Journal of Botany 69: 82–97.
    1. Barreto E, Lim MC, Rojas D, Dávalos LM, Wüest RO, Machac A, Graham CH. 2023. Morphology and niche evolution influence hummingbird speciation rates. Proceedings of the Royal Society B: Biological Sciences 290: 20221793. - PMC - PubMed
    1. Beaulieu JM, O'Meara BC, Donoghue MJ. 2013. Identifying hidden rate changes in the evolution of a binary morphological character: the corHMM model. Systematic Biology 62: 773–784. - PubMed

LinkOut - more resources