

BiGSM: Bayesian inference of gene regulatory network via sparse modelling
- PMID: 40484997
- PMCID: PMC12151459
- DOI: 10.1093/bioinformatics/btaf318
BiGSM: Bayesian inference of gene regulatory network via sparse modelling
Abstract
Motivation: Inference of gene regulatory network (GRN) is challenging due to the inherent sparsity of the GRN matrix and noisy expression data, often leading to a high possibility of false positive or negative predictions. To address this, it is essential to leverage the sparsity of the GRN matrix and develop a robust method capable of handling varying levels of noise in the data. Moreover, most existing GRN inference methods produce only fixed point estimates, which lack the flexibility and informativeness for comprehensive network analysis. In contrast, a Bayesian approach that yields closed-form posterior distributions allows probabilistic link selection, offering insights into the statistical confidence of each possible link. Consequently, it is important to engineer a Bayesian GRN inference method and rigorously execute a benchmark evaluation compared to state-of-the-art methods.
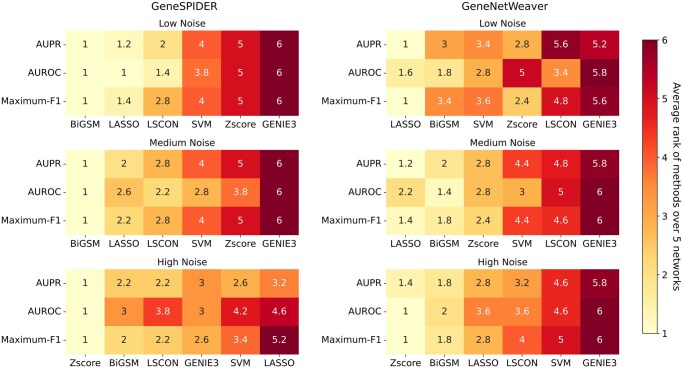
Results: We propose a method-Bayesian inference of GRN via Sparse Modelling (BiGSM). BiGSM effectively exploits the sparsity of the GRN matrix and infers the posterior distributions of GRN links from noisy expression data by using the maximum likelihood based learning. We thoroughly benchmarked BiGSM using biological and simulated datasets including GeneNetWeaver, GeneSPIDER, and GRNbenchmark. The benchmark test evaluates its accuracy and robustness across varying noise levels and data models. Using point-estimate based performance measures, BiGSM provides an overall best performance in comparison with several state-of-the-art methods including GENIE3, LASSO, LSCON, and Zscore. Additionally, BiGSM is the only method in the set of competing methods that provides posteriors for the GRN weights, helping to decipher confidence across predictions.
Availability and implementation: Code implemented via MATLAB and Python are available at Github: https://github.com/SachLab/BiGSM and archived at zenodo.
© The Author(s) 2025. Published by Oxford University Press.
Figures


Similar articles
-
Multi-objective context-guided consensus of a massive array of techniques for the inference of Gene Regulatory Networks.Comput Biol Med. 2024 Sep;179:108850. doi: 10.1016/j.compbiomed.2024.108850. Epub 2024 Jul 15. Comput Biol Med. 2024. PMID: 39013340
-
Prediction of gene regulatory connections with joint single-cell foundation models and graph-based learning.Bioinformatics. 2025 Jul 1;41(Supplement_1):i619-i627. doi: 10.1093/bioinformatics/btaf217. Bioinformatics. 2025. PMID: 40662821 Free PMC article.
-
Prediction of Gene Regulatory Connections with Joint Single-Cell Foundation Models and Graph-Based Learning.bioRxiv [Preprint]. 2025 Jan 29:2024.12.16.628715. doi: 10.1101/2024.12.16.628715. bioRxiv. 2025. Update in: Bioinformatics. 2025 Jul 1;41(Supplement_1):i619-i627. doi: 10.1093/bioinformatics/btaf217. PMID: 39975293 Free PMC article. Updated. Preprint.
-
Assessing the comparative effects of interventions in COPD: a tutorial on network meta-analysis for clinicians.Respir Res. 2024 Dec 21;25(1):438. doi: 10.1186/s12931-024-03056-x. Respir Res. 2024. PMID: 39709425 Free PMC article. Review.
-
Incentives for preventing smoking in children and adolescents.Cochrane Database Syst Rev. 2017 Jun 6;6(6):CD008645. doi: 10.1002/14651858.CD008645.pub3. Cochrane Database Syst Rev. 2017. PMID: 28585288 Free PMC article.
References
-
- Aghdam R, Ganjali M, Zhang X et al. Cn: a consensus algorithm for inferring gene regulatory networks using the sorder algorithm and conditional mutual information test. Mol Biosyst 2015;11:942–9. - PubMed
-
- Ashworth A, Lord CJ, Reis-Filho JS. Genetic interactions in cancer progression and treatment. Cell 2011;145:30–8. - PubMed
-
- Bishop CM, Nasrabadi NM. Pattern Recognition and Machine Learning, Vol. 4. New York: Springer, 2006.
-
- Boone C, Bussey H, Andrews BJ. Exploring genetic interactions and networks with yeast. Nat Rev Genet 2007;8:437–49. - PubMed
MeSH terms
LinkOut - more resources
Full Text Sources
Miscellaneous
