. 2025 Jun;31(6):e70288.
doi: 10.1111/gcb.70288.

Warmer Lakes Support Phytoplankton Over Fish

Affiliations

Warmer Lakes Support Phytoplankton Over Fish

Benjamin Paul Mooney et al. Glob Chang Biol. 2025 Jun.

Abstract

Climate warming reshapes biomass distributions across trophic levels in aquatic systems, with implications for ecosystem functioning and service provisioning. Using a space-for-time approach across temperate and boreal lakes, we analyse a dataset spanning wide gradients in temperature and nutrient availability, including species and biomass data for phytoplankton, fish, and, in some cases, zooplankton. We hypothesise that (1) warmer lakes have higher fish-to-phytoplankton biomass ratios than colder lakes, and (2) this relationship weakens at high phosphorus levels due to proliferation of inedible phytoplankton. Contrary to expectations, our results show that warmer lakes exhibit lower fish-to-phytoplankton biomass ratios, regardless of phosphorus concentrations or the contribution of benthic relative to whole lake primary production. This suggests reduced energy transfer efficiency from producers to consumers in warming waters. Changes in phytoplankton and fish community composition are likely part of the explanation for why increased phytoplankton biomass in warmer lakes does not translate into higher fish biomass. Our findings highlight a critical shift in biomass distribution from fish to phytoplankton with rising temperatures in northern lakes, potentially signalling future declines in food web efficiency and predator biomass under continued climate warming.

Keywords: aquatic food webs; biomass distribution; climate warming; energy transfer efficiency; temperature gradient.


Conflict of interest statement

The authors declare no conflicts of interest.

Figures

FIGURE 1
FIGURE 1
A map of Sweden marking the distribution of the 125 study lakes included in this analysis. Lakes are coloured based on the (left map) average air temperature and (right) average annual total phosphorus concentration of the lake recorded from May to September 2004–2023. Circles indicate lakes with both phytoplankton and fish data, triangles indicate lakes with only phytoplankton data, and squares indicate lakes with only fish data. Black rings mark the location of the 10 trend lakes.
FIGURE 2
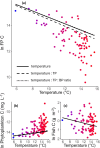
FIGURE 2
Relationships between temperature and (a) the ln ratio of fish‐phytoplankton (F/P) carbon biomass, (b) ln phytoplankton carbon biomass, and (c) ln fish carbon biomass per unit effort. Solid lines show the main effect of temperature; dashed lines indicate the temperature effect including the temperature × total phosphorus (TP) interaction; and dotted lines represent the temperature effect including the three‐way interaction between temperature, TP, and the benthic/pelagic (B/P) production ratio. Lines reflect significant model predictions (p < 0.05) from linear models (Table 1). Differences in slope among line types illustrate how the relationship between temperature and biomass shifts depending on nutrient availability and the B/P production ratio. Point colours represent mean air temperature, from blue (colder lakes) to red (warmer lakes).
FIGURE 3
FIGURE 3
The relationship between temperature and (a) ln phytoplankton carbon biomass, (b) square root zooplankton carbon biomass, (c) ln fish carbon biomass per unit effort (CPUE), (d) ln zooplankton‐phytoplankton carbon biomass ratio, (e) ln fish‐zooplankton carbon biomass ratio and (f) ln fish‐phytoplankton carbon biomass ratio. Data are from the 10 trend lakes sampled from 2014 to 2023. Each point is plotted using the mean air temperature recorded over the productive period (May to September) during the same year the biomass data were collected. Smaller points represent annual means, and larger points represent mean values across the entire time period for each lake. Solid lines reflect significant relationships (p < 0.05), and dashed lines indicate non‐significant relationships from linear mixed effect models (Table 2). Point colours represent mean air temperature, from blue (colder lakes) to red (warmer lakes).

References

    1. Anderson, D. M. , Burkholder J. M., Cochlan W. P., et al. 2008. “Harmful Algal Blooms and Eutrophication: Examining Linkages From Selected Coastal Regions of the United States.” Harmful Algae 8, no. 1: 39–53. 10.1016/j.hal.2008.08.017. - DOI - PMC - PubMed
    1. Anderson, S. I. , Franzè G., Kling J. D., et al. 2022. “The Interactive Effects of Temperature and Nutrients on a Spring Phytoplankton Community.” Limnology and Oceanography 67, no. 3: 634–645. 10.1002/lno.12023. - DOI
    1. Appelberg, M. 2000. “Swedish Standard Methods for Sampling Freshwater Fish With Multi‐Mesh Gillnets.”
    1. Appelberg, M. , Berger H.‐M., Hesthagen T., et al. 1995. “Development and Intercalibration of Methods in Nordic Freshwater Fish Monitoring.” Water, Air, and Soil Pollution 85, no. 2: 401–406. 10.1007/BF00476862. - DOI
    1. Arranz, I. , Grenouillet G., and Cucherousset M.. 2023. “Climate Warming Effects on Stream‐Fish Size Spectra Are Modulated by Other Perturbations.” Nature Ecology & Evolution 7, no. 7: 977–978. 10.1038/s41559-023-02085-x. - DOI - PubMed