. 2025 Jun 9;10(11):e190094.
doi: 10.1172/jci.insight.190094.

De novo variant in RING finger protein 213 causes systemic vasculopathy

Affiliations

De novo variant in RING finger protein 213 causes systemic vasculopathy

Ayako Kashimada et al. JCI Insight. .

Abstract

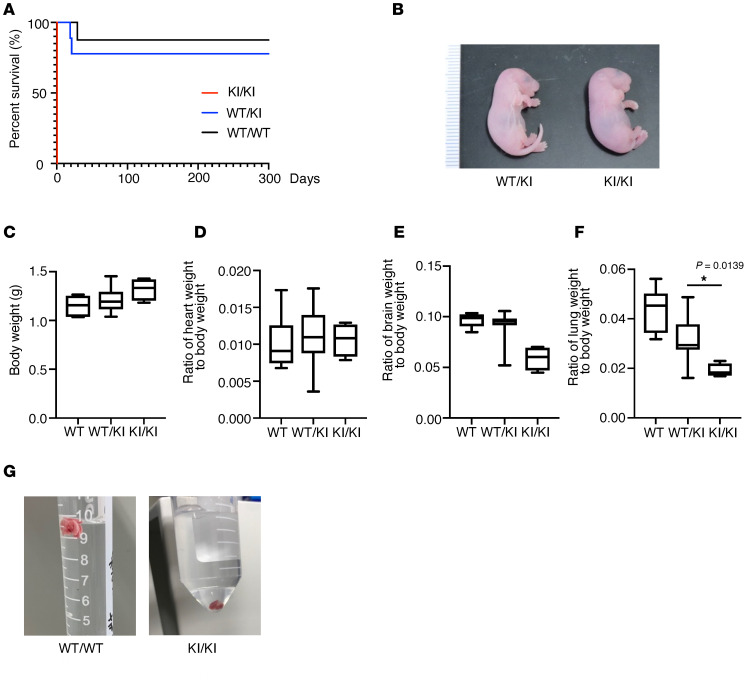
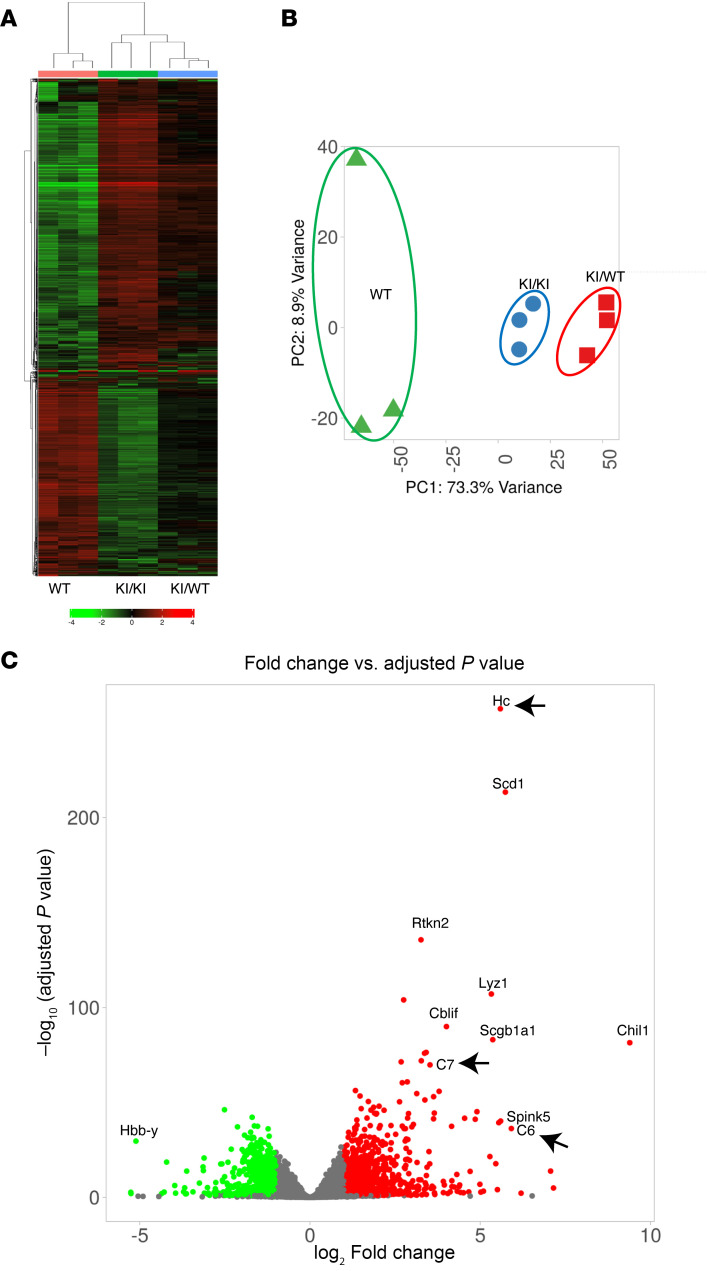
Systemic arterial stenosis, including moyamoya disease (MMD) and middle aortic syndrome (MAS), is a rare condition of unclear etiology. MMD is a cerebral angiopathy, and MAS affects the abdominal and thoracic aorta. Although some genetic associations with MAS have been identified, the causes remain elusive. In this study, de novo heterozygous missense variants of RING finger protein 213 (RNF213) (p.His4058Pro and p.Thr4155Pro) in 2 unrelated families with MAS and MMD were studied by whole-exome sequencing. To elucidate the significance of these variants, we produced knockin mice carrying the Rnf213 p.His4058Pro variant. Homozygous knockin mice exhibited perinatal lethality because of respiratory failure and lung dysplasia, suggesting that this variant is pathogenic. Lung dysplasia in homozygous knockin mice was associated with upregulated innate immunity and inflammatory responses and downregulated cell proliferation. These findings suggested that in mice, the RNF213 p.His4058Pro variant plays critical roles in regulation of innate immunity and inflammation that affect lung development, revealing the complexity of RNF213 function in various tissues and species. In conclusion, this study provides insights into the genetic basis of MAS and MMD, highlights the potential involvement of RNF213 variants in systemic vasculopathy, and identifies unexpected associations with lung development and immune processes.

Keywords: Development; Genetic diseases; Innate immunity; Vascular biology.


Conflict of interest statement

Conflict of interest: The authors have declared that no conflict of interest exists.

Figures

Figure 1
Figure 1. Clinical imaging data of the patients.
Upper. Patient 1 at 4 years and 3 months. Magnetic resonance angiography (MRA) frontal (A) and axial (B) views of the cerebral artery show bilateral severe stenosis of the internal carotid artery. The right anterior and right middle cerebral arteries are not detected. Brain atrophy of the right cerebral hemisphere and bilateral high intensity on white matter lesion on FLAIR-MRI (C). Three-dimensional CT angiography at 2 years and 10 months shows narrowing across the thoracoabdominal aorta to the iliac artery (D). Middle. Patient 2 at 1 year and 5 months. MRA frontal (E) and axial (F) views of the cerebral artery show bilateral severe stenosis of the internal carotid artery and bilateral vertebral artery to basilar artery stenosis. Brain FLAIR-MRI at 1 year and 8 months shows old cerebral infarcts in the left frontoparietal and right temporal and occipital lobes (G). Angiography at 1 year and 11 months showed stenosis of the abdominal aorta and bilateral renal arteries (H) as well as peripheral pulmonary artery stenosis (I).
Figure 2
Figure 2. Sequence of RNF213.
De novo RNF213 variants were confirmed by Sanger sequencing in patients 1 (A) and 2 (B). Schematic image of RNF213 domains and location of the variant. (C) The conservation of the codon where the variant located in the vertebrae. Sequences were aligned using National Center for Biotechnology Information (NCBI) HomoloGene.
Figure 3
Figure 3. Phenotypic comparison of Rnf213WT/WT and Rnf213WT/H4008P and Rnf213H4008P/H4008P littermates on P0.
(A) Kaplan-Meier survival curves of Rnf213WT/H4008P littermate mice. The littermates were fostered by surrogate mothers (WT/WT, n = 12; WT/KI, n = 12; and KI/KI, n = 4). (B) External appearance of P0 Rnf213WT/H4008P and Rnf213H4008P/H4008P mice. scale bar: 1 mm. (C) Comparison of body weight between genotypes (WT/WT, n = 7; WT/KI, n = 24; and KI/KI, n = 4). (D) Comparison of heart weight between genotypes (WT/WT, n = 6; WT/KI, n = 18; and KI/KI, n = 4). (E) Comparison of brain weight between genotypes (WT/WT, n = 7; WT/KI, n = 15; and KI/KI, n = 4). (F) Comparison of lung weight between genotypes (WT/WT, n = 7; WT/KI, n = 19; and KI/KI, n = 4). (G) Whole lungs were placed in PBS at P0. The lungs of WT/WT mice floated, and those of KI/KI mice sank at the bottom of the PBS. Data are presented as mean ± SD. Box plots show the interquartile range, median (line), and minimum and maximum (whiskers). *P < 0.05. WT/WT, Rnf213WT/WT mice; WT/KI, Rnf213WT/H4008P mice; KI/KI, Rnf213H4008P/H4008P mice.
Figure 4
Figure 4. Phenotypic analysis of E18.5 Rnf213H4008P/H4008P mice reveals abnormal lung appearance.
(A) Morphology of lung tissue and alveoli in E18.5 Rnf213WT/WT and Rnf213WT/H4008P Rnf213H4008P/H4008P mice. Whole lungs (upper: frontal view and middle: back view; scale bar: 1 mm) and H&E-stained lungs (lower: 20× original magnification, scale bar: 100 μm). (B) Representative images showing immunohistochemistry of pro-surfactant protein C (proSP-C), podoplanin (Pdpn), club cell secretory protein (Cc10), and α–smooth muscle actin (α-SMA) in E18.5 Rnf213WT/WT and Rnf213WT/H4008P Rnf213H4008P/H4008P lung tissue (40× original magnification; scale bar: 50 μm). WT/WT, Rnf213WT/WT mice; WT/KI, Rnf213WT/H4008P mice; KI/KI, Rnf213H4008P/H4008P mice.
Figure 5
Figure 5. RNA-Seq analysis reveals different gene expression profiles between Rnf213WT/WT and Rnf213H4008P/H4008P mice.
(A) Unsupervised hierarchical clustering using top 2,000 differentially expressed genes (DEGs) of transcriptomes from E18.5 Rnf213WT/WT, Rnf213WT/H4008P, and Rnf213H4008P/H4008P mouse lungs. (B) Principal component analysis same as in A. (C) DEGs shown as a volcano plot. Upregulated complement components (Hc, C6, and C7) are indicated by arrows. WT/WT, Rnf213WT/WT mice; WT/KI, Rnf213WT/H4008P mice; KI/KI, Rnf213H4008P/H4008P mice.
Figure 6
Figure 6. Annotation of DEGs and enrichment analysis.
(A) Metascape analysis of DEGs (log2FC > 2 and FDR < 0.1) in the lungs of E18.5 Rnf213H4008P/H4008P mice compared with Rnf213WT/WT mice. Enriched annotations for upregulated genes. (B) Bubble chart shows KEGG pathway enrichment of upregulated DEGs. (C) GSEA profile of complement and coagulation cascade between E18.5 Rnf213H4008P/H4008P and Rnf213WT/WT mouse lungs. (D) Enriched annotations for downregulated genes with Metascape analysis. (E) Bubble chart shows KEGG pathway enrichment of downregulated DEGs. (F) GSEA enrichment profile of the cell cycle.
Figure 7
Figure 7. Expression of genes involved in innate immunity and complement system in the E18.5 lung.
(A) Expression of genes involved in innate immunity and complement system in the lungs of E18.5 Rnf213H4008P/H4008P mice compared with Rnf213WT/WT mice. In the upper and lower row, the representative marker of white blood cell subpopulation and protein name are listed, respectively. Mono/Macro/Dend, monocyte/macrophage/dendritic cell; TMM, EdgeR’s trimmed mean of M values. (B) Immunohistochemistry staining for C5a (red) and cell nuclei (blue, DAPI) (63× original magnification, scale bar: 10 μm). (C) Arrows, F4/80-positive cells (M1 and M2 macrophages) were stained dark brown, whereas the nuclei were stained purple in E18.5 Rnf213WT/WT, Rnf213WT/H4008P, and Rnf213H4008P/H4008P lungs (20× original magnification, scale bar: 250 μm). (D) F4/80-positive cells (M1 and M2 macrophages) calculated as percentage of total area per caudal lobe tissue, with comparison between genotypes. (WT/WT, n = 2; WT/KI, n = 2; and KI/KI, n = 2.) Box plots show the interquartile range, median (line), and minimum and maximum (whiskers). Only 2 samples were available; therefore, statistical analysis was not performed. WT/WT, Rnf213WT/WT mice; WT/KI, Rnf213WT/H4008P mice; KI/KI, Rnf213H4008P/H4008P mice.

References

    1. Liu E, et al. Clinical value of the systemic immune-inflammation index in moyamoya disease. Front Neurol. 2023;14:1123951. doi: 10.3389/fneur.2023.1123951. - DOI - PMC - PubMed
    1. Kamada F, et al. A genome-wide association study identifies RNF213 as the first Moyamoya disease gene. J Hum Genet. 2011;56(1):34–40. doi: 10.1038/jhg.2010.132. - DOI - PubMed
    1. Fukushima H, et al. Homozygosity for moyamoya disease risk allele leads to moyamoya disease with extracranial systemic and pulmonary vasculopathy. Am J Med Genet A. 2016;170(9):2453–2456. doi: 10.1002/ajmg.a.37829. - DOI - PubMed
    1. Kobayashi H, et al. Rare variants in RNF213, a susceptibility gene for moyamoya disease, are found in patients with pulmonary hypertension and aggravate hypoxia-induced pulmonary hypertension in mice. Pulm Circ. 2018;8(3):2045894018778155. doi: 10.1177/2045894018778155. - DOI - PMC - PubMed
    1. Connolly JE, et al. Middle aortic syndrome: distal thoracic and abdominal coarctation, a disorder with multiple etiologies. J Am Coll Surg. 2002;194(6):774–781. doi: 10.1016/S1072-7515(02)01144-4. - DOI - PubMed

LinkOut - more resources