

Ferroptosis-related lncRNAs as prognostic biomarkers in renal cell carcinoma: a systematic review and meta-analysis
- PMID: 40485738
- PMCID: PMC12141022
- DOI: 10.3389/fonc.2025.1579013
Ferroptosis-related lncRNAs as prognostic biomarkers in renal cell carcinoma: a systematic review and meta-analysis
Abstract
Background: Abundant evidences have indicated that long non-coding RNAs (lncRNAs) can be used to evaluate the prognosis of patients with renal cell carcinoma (RCC), and the purpose of this study was to evaluate the association between ferroptosis-related lncRNAs (FRLs) and the prognosis of patients with RCC by means of a meta-analysis.
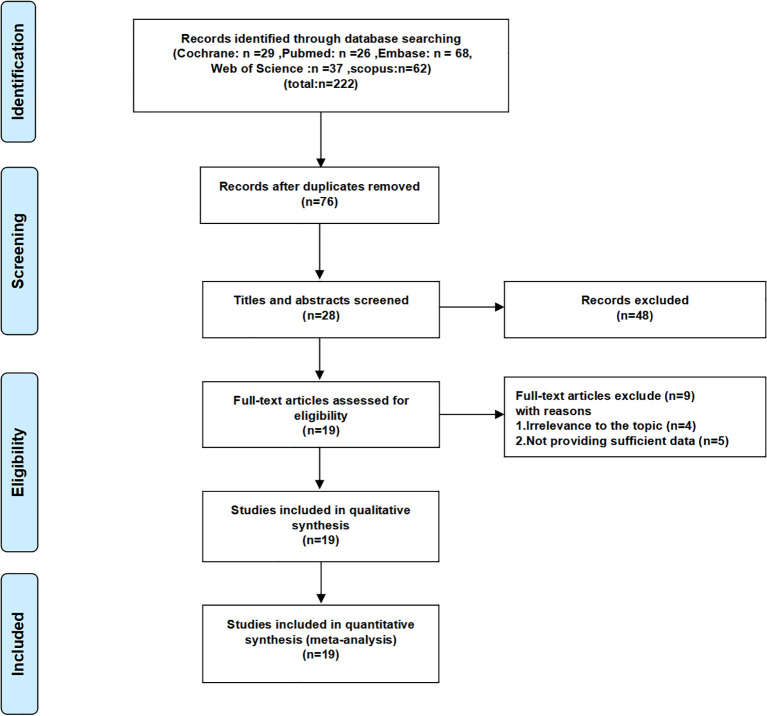
Materials and methods: All studies assessing the prognosis of patients with FRLs and RCC were collected up to 31 October 2024 by searching databases such as PubMed, Web of Science, Embase, Scopus and Cochrane Library. Pooled analyses were performed on the collected data, including metrics such as gender, age, risk score, tumor stage, and tumor grade. Hazard ratio (HR) and 95% confidence intervals (CI) were employed to assess the outcome metrics. To evaluate the heterogeneity among studies, the I² statistic and Q test were utilized. P < 0.05 was regarded as statistically significant. All data analyses were conducted by Stata 17.0 software and Review Manager 5.4.1.
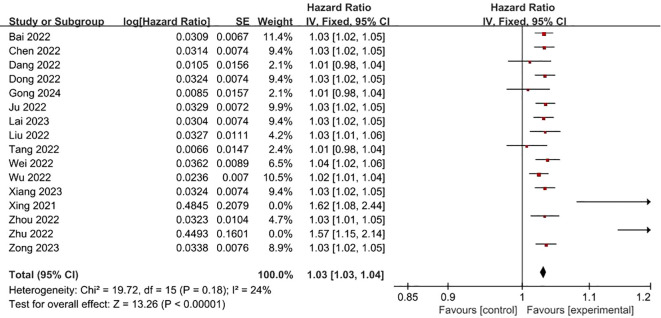
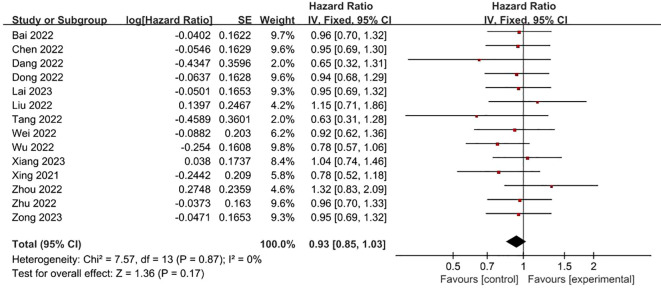
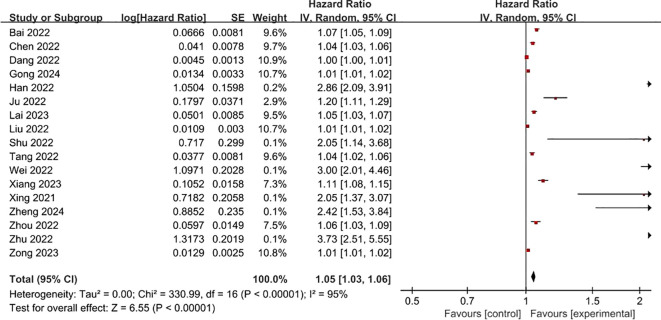
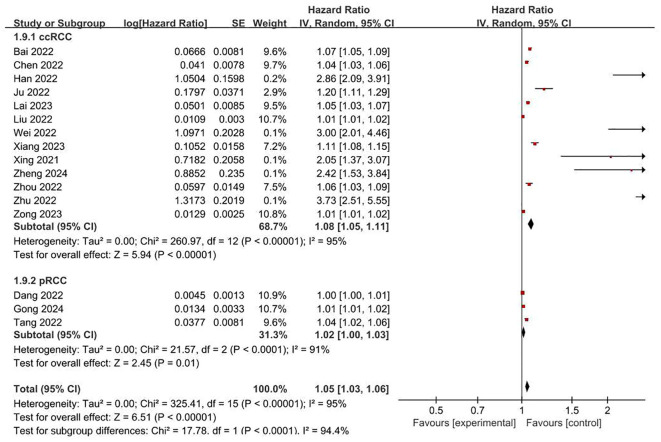
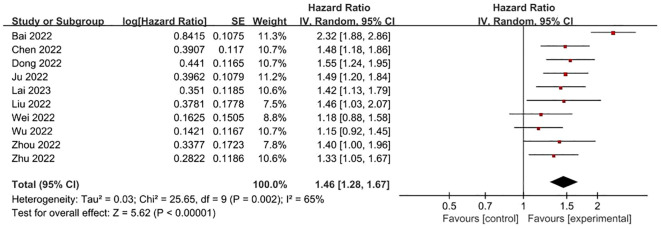
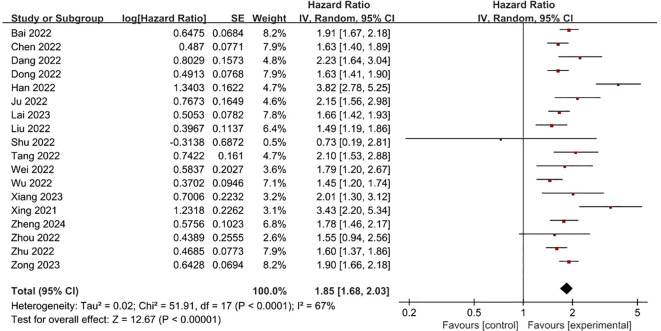
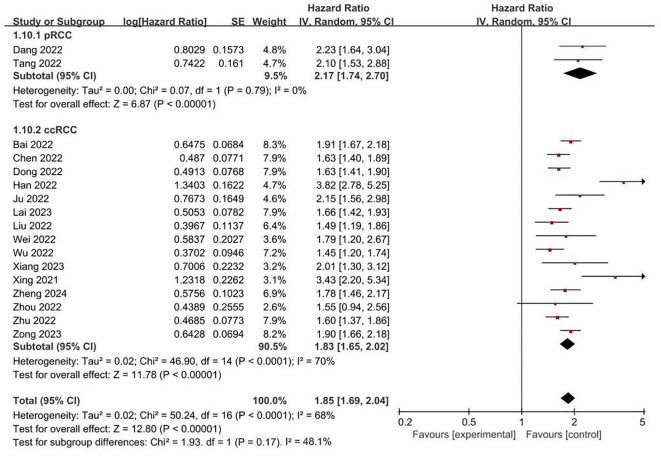
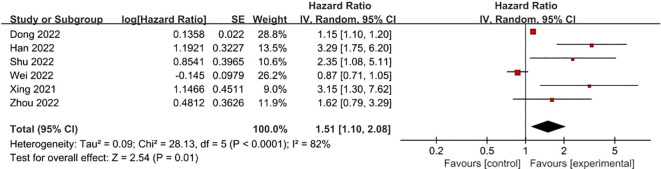
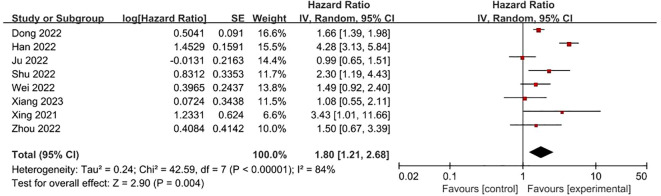
Results: 19 literatures involving 5974 RCC patients were included in this study. The meta-analysis outcomes indicate that there was no significant correlation between FRLs and the gender of RCC patients (HR = 0.93, 95% CI = 0.85 - 1.03, P = 0.17). However, FRLs were associated with patient age (HR = 1.03, 95% CI = 1.03 - 1.04, P < 0.00001), risk score (HR = 1.05, 95% CI = 1.03 - 1.06, P < 0.00001), tumor grade (HR = 1.46, 95% CI = 1.28 - 1.67, P < 0.00001) and tumor stage (HR = 1.85, 95% CI = 1.68-2.03, P < 0.00001) were significantly correlated. In tumor staging, FRLs were significantly correlated with N-stage (HR = 1.51, 95% CI = 1.10 - 2.08, P = 0.01) and M-stage (HR = 1.80, 95% CI = 1.21 - 2.68, P = 0.004) in patients with RCC, but not significantly correlated with T-stage in patients (HR = 1.34, 95% CI = 0.86 - 2.09, P = 0.19).
Conclusion: The findings of this study indicate that the abnormal expression of FRLs in RCC is obviously associated with the prognosis of patients, and that FRLs can be used as a new tumor marker to predict the prognosis of RCC patients with high accuracy.
Systematic review registration: https://www.crd.york.ac.uk/PROSPERO/view/CRD42024610803, identifier CRD42024610803.
Keywords: ferroptosis; lncRNAs; meta-analysis; prognosis; renal cell carcinoma.
Copyright © 2025 Lin, Wu, Zhang, Luo and Chen.
Conflict of interest statement
The authors declare that the research was conducted in the absence of any commercial or financial relationships that could be construed as a potential conflict of interest.
Figures

Similar articles
-
Analysis of Ferroptosis-Related LncRNAs Signatures Associated with Tumor Immune Infiltration and Experimental Validation in Clear Cell Renal Cell Carcinoma.Int J Gen Med. 2022 Mar 19;15:3215-3235. doi: 10.2147/IJGM.S354682. eCollection 2022. Int J Gen Med. 2022. PMID: 35342303 Free PMC article.
-
Prognostic value of pretreatment neutrophil-to-lymphocyte ratio in renal cell carcinoma: a systematic review and meta-analysis.BMC Urol. 2020 Jul 6;20(1):90. doi: 10.1186/s12894-020-00665-8. BMC Urol. 2020. PMID: 32631294 Free PMC article.
-
Construction of a ferroptosis-related signature based on seven lncRNAs for prognosis and immune landscape in clear cell renal cell carcinoma.BMC Med Genomics. 2022 Dec 17;15(1):263. doi: 10.1186/s12920-022-01418-2. BMC Med Genomics. 2022. PMID: 36528763 Free PMC article.
-
The effect of perioperative blood transfusion on survival after renal cell carcinoma nephrectomy: A systematic review and meta-analysis.Front Oncol. 2023 Feb 16;13:1092734. doi: 10.3389/fonc.2023.1092734. eCollection 2023. Front Oncol. 2023. PMID: 36874080 Free PMC article.
-
Folic acid supplementation and malaria susceptibility and severity among people taking antifolate antimalarial drugs in endemic areas.Cochrane Database Syst Rev. 2022 Feb 1;2(2022):CD014217. doi: 10.1002/14651858.CD014217. Cochrane Database Syst Rev. 2022. PMID: 36321557 Free PMC article.
References
Publication types
LinkOut - more resources
Full Text Sources