. 2025 May 7:52:344-359.
doi: 10.1016/j.jot.2025.03.013. eCollection 2025 May.

GPX4 activator enhances neuroprotection and functional recovery in spinal cord injury

Affiliations

GPX4 activator enhances neuroprotection and functional recovery in spinal cord injury

Xinjie Liu et al. J Orthop Translat. .

Abstract

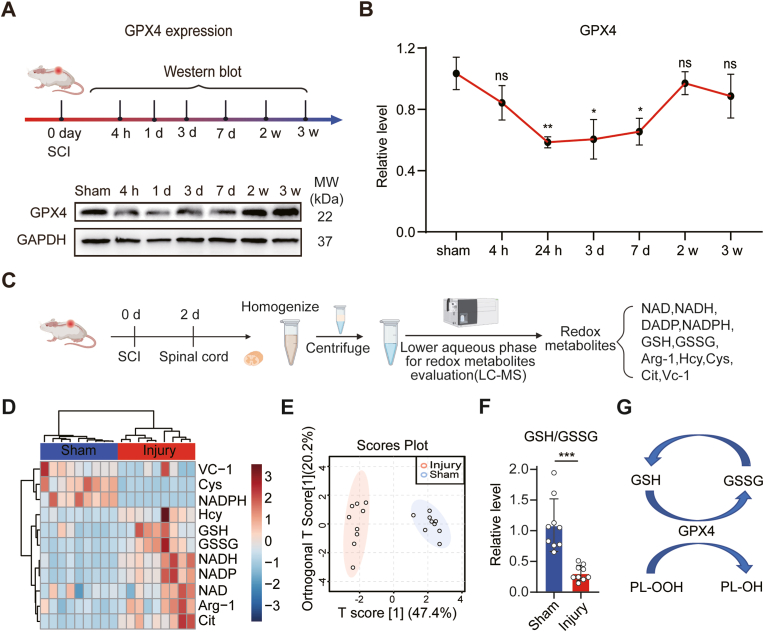
Background: Spinal cord injury (SCI) exerts severe physical, social, and economic effects on individuals and the healthcare system. While much progress has been made in understanding the pathophysiology of SCI, the regulation of the ferroptosis master regulator, GPX4 (Glutathione Peroxidase 4), remains poorly understood.

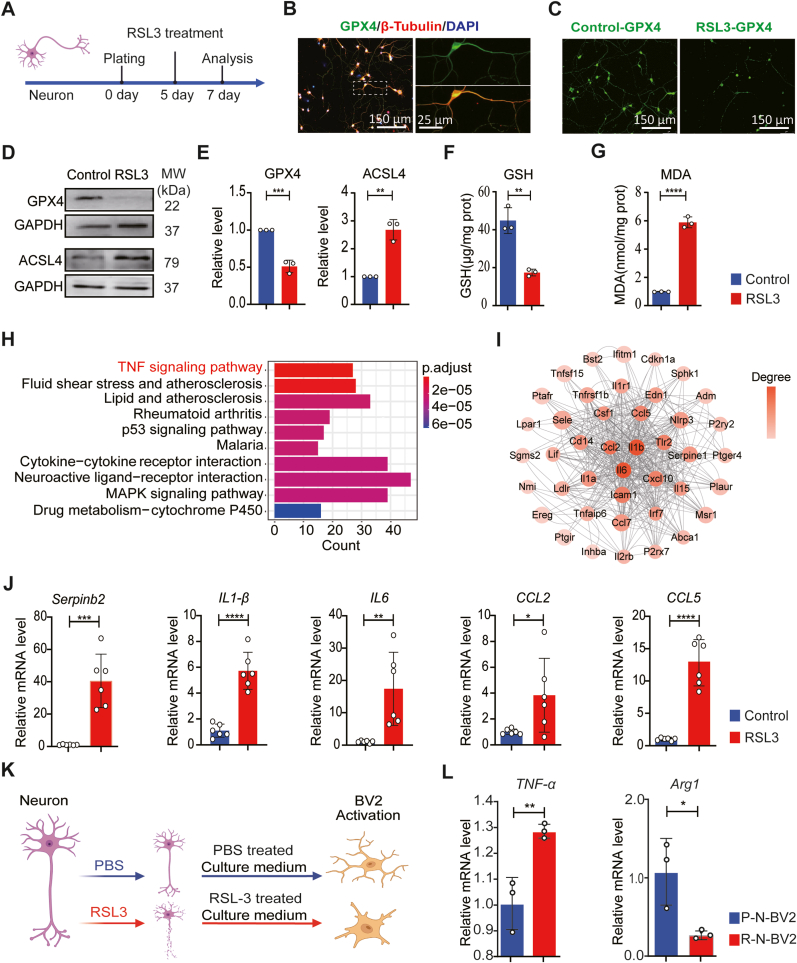
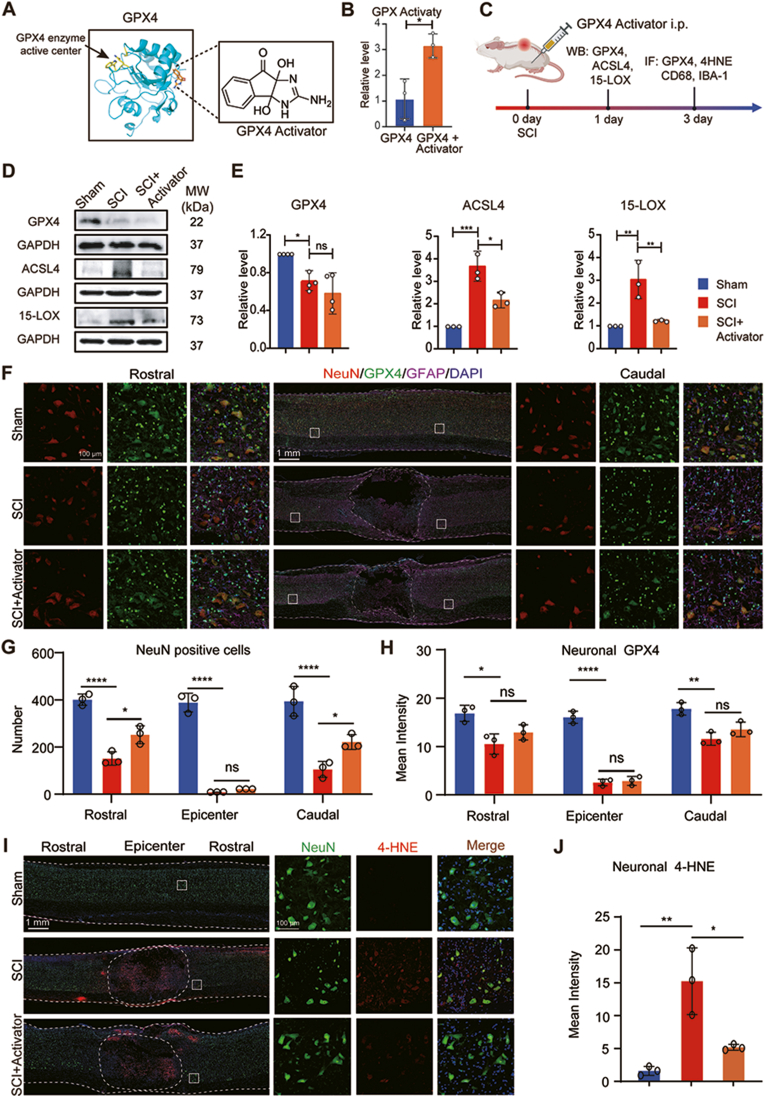
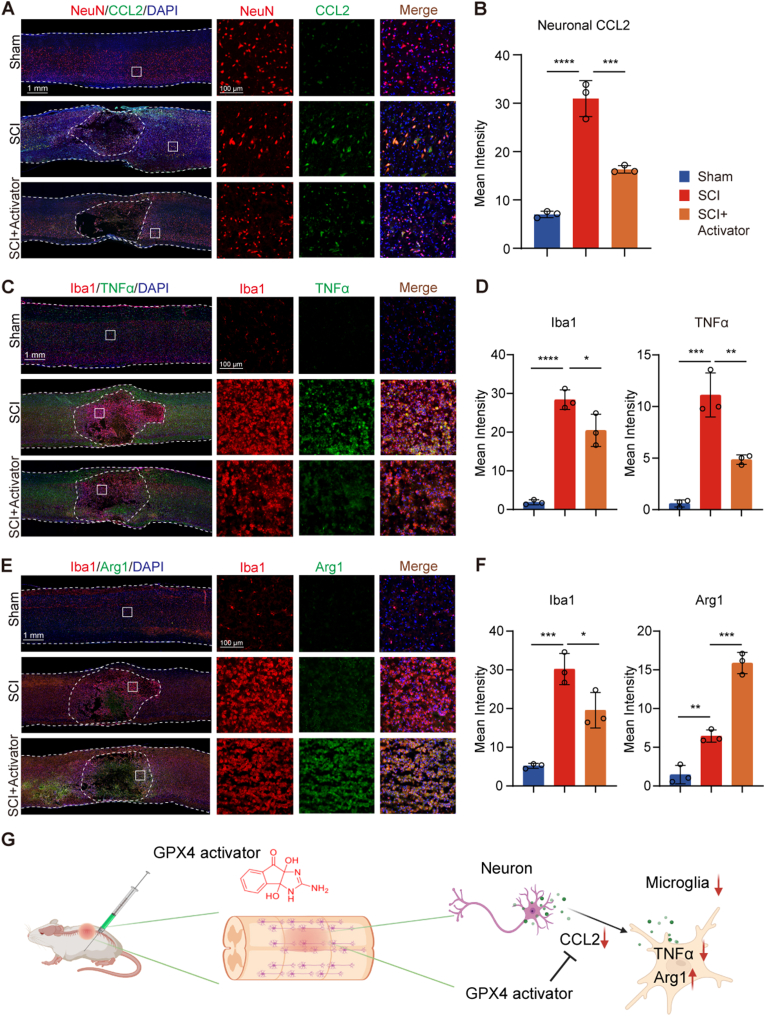
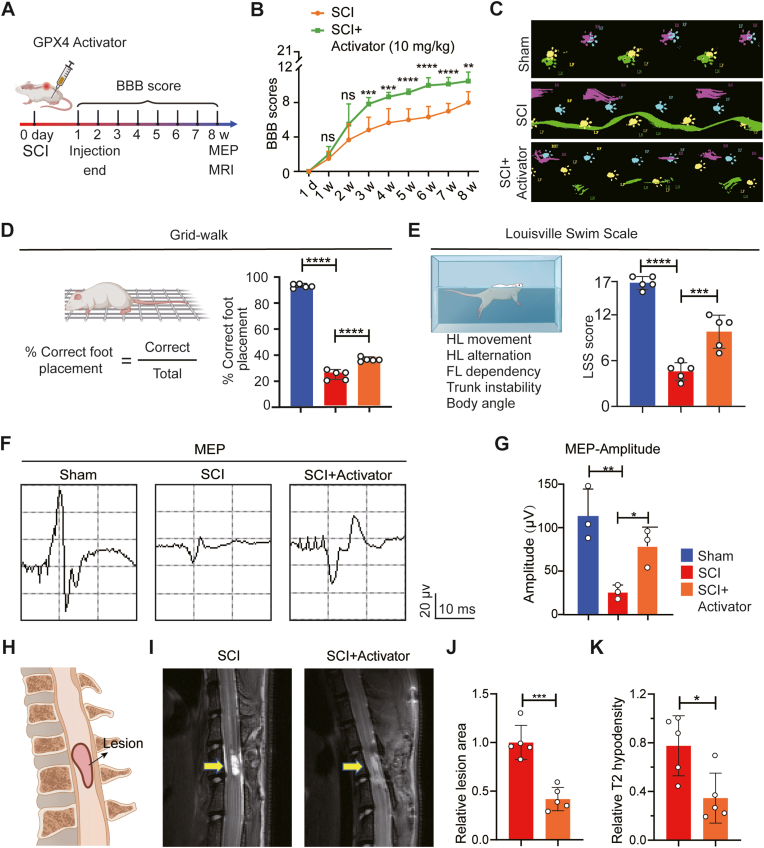
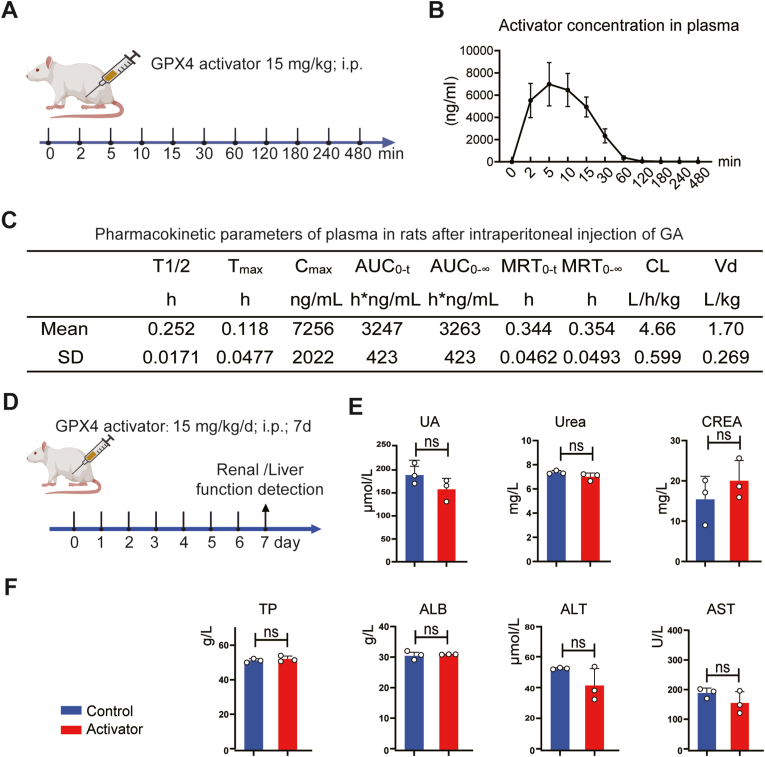
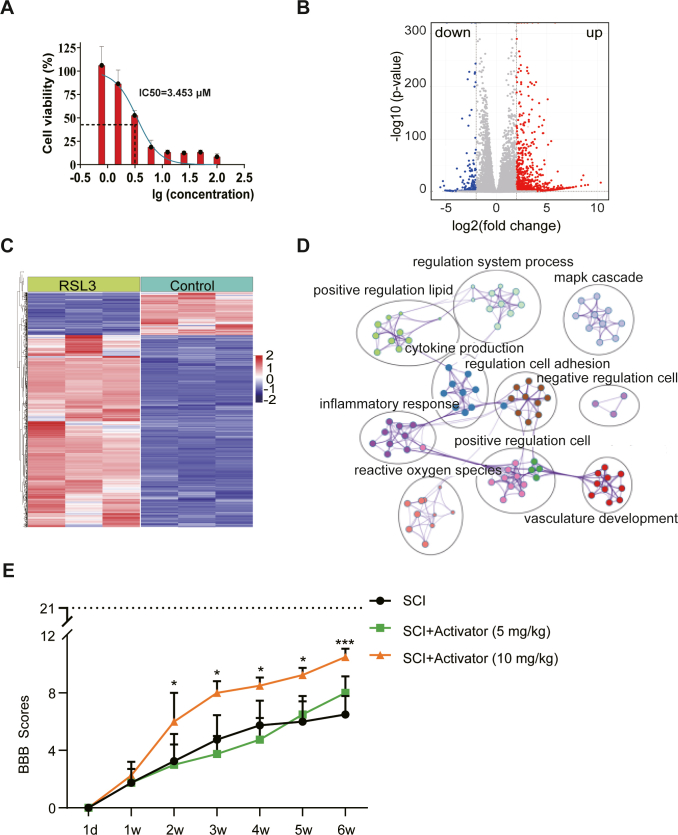
Methods: In a rat T10 contusion SCI model, GPX4 expression was tracked with western blot and immunofluorescence. Ferroptosis was induced in primary neurons using the GPX4 inhibitor RSL3, and inflammatory cytokine release was measured. Conditioned media from these neurons was applied to microglia to assess activation. The GPX4 activator PKUMDL-LC-102 was administered to SCI rats, with functional recovery evaluated through behavioral tests, MRI, and motor-evoked potentials.

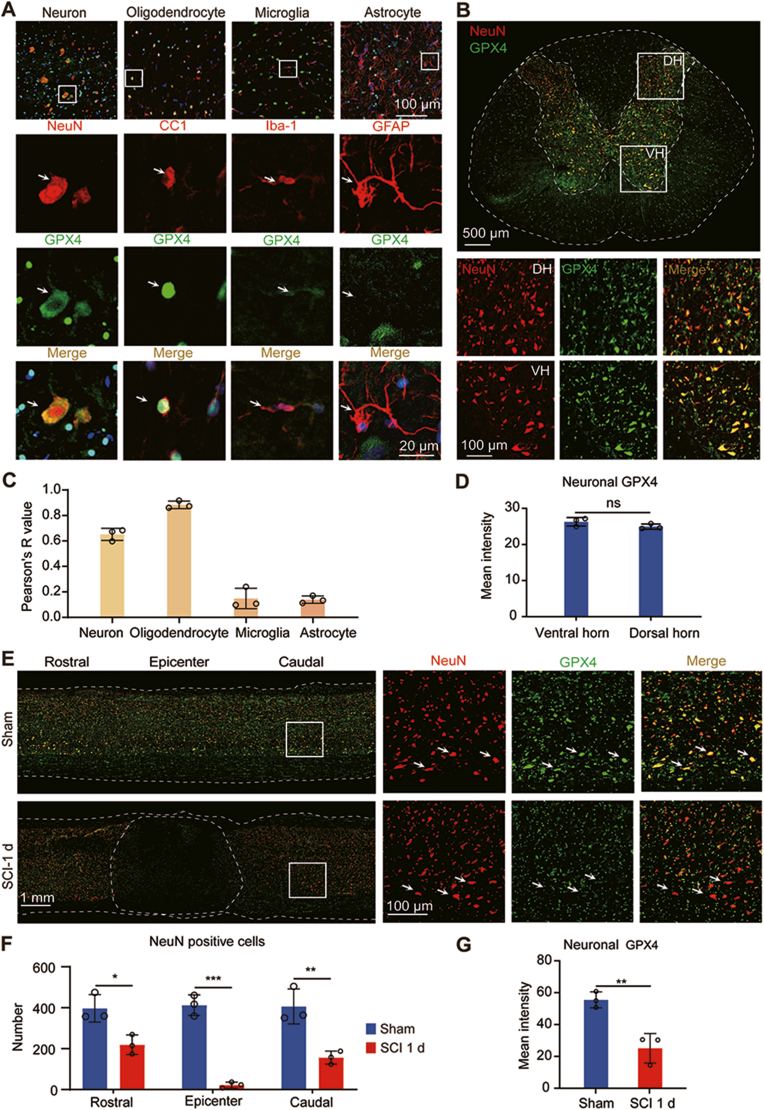
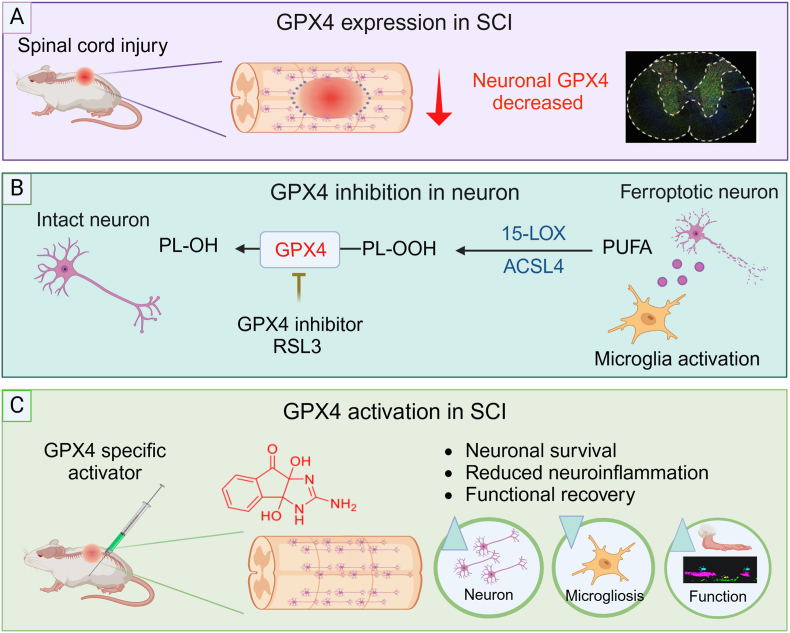
Results: We first reveal a temporal and spatial decrease of GPX4 levels in neurons after SCI. We then demonstrate that GPX4 inhibition leads to primary neuronal ferroptosis, triggering the secretion of pro-inflammatory cytokines that activate microglia. This study represents the initial in vivo investigation of GPX4-specific targeted activation, demonstrating its potential to promote functional recovery in contusive SCI by improving neuronal survival and reducing microgliosis.

Conclusion: These findings highlight the significance of GPX4 as a key factor for neuroprotection in the spinal cord. We identified the pivotal role of GPX4 in SCI and realize the neuroprotection via specific GPX4 activation to improve functional recovery in vivo.

The translational potential of this article: These findings provide a novel avenue for therapeutic intervention to enhance functional recovery after SCI through GPX4 targeted activation.

Keywords: Ferroptosis; GPX4 activation; Neuroinflammation; Neuroprotection; Spinal cord injury.


Conflict of interest statement

X.L, Y.P, and B.F. contributed equally to this work. X.L.,Y.P., and B.F. co-designed the study, conducted experiments, analyzed and interpreted the data, co-made the figures, and co-wrote the manuscript. Y.P., J.Z., and X.L. conducted SCI surgery and western blotting. B.F. assisted in neuron cultures and provided RNA sequencing data. C.Z. and T.Z. performed analyses. Y.L. assisted with small molecule biosafety study. X.Z. performed LC-MS/MS analysis of redox metabolites. Y.L. and L.L. assisted in GPX4 activator studies. X.W. and G.N. co-supervised the project and contributed to experimental design, interpretation, and manuscript editing. X.Y., W.L., and S.F. supervised the project, guided experimental design and interpretation, co-made the figures, and co-wrote the manuscript. All authors declare that we have no known competing financial interests or personal relationships that could have appeared to influence the work reported in this paper. This declaration serves to demonstrate our commitment to scientific ethics and to ensure the trustworthiness of our research findings.

Figures

Image 1
Graphical abstract
Fig. 1
Fig. 1
Temporal expression profile of GPX4 and redox metabolomics after SCI A Representative Western Blot images of GPX4 at different time points after SCI. B Quantification of the GPX4 expression level at different time points after SCI, GAPDH was used as an internal control for Western blot normalization (n = 4, Data are presented as Mean ± SD, and statistical significance was determined by one-way ANOVA with Tukey's post-hoc test). C Experimental design of redox environment metabolomic evaluation. D Heatmap showing the changing metabolites between Sham and Injury groups at 2 days after SCI. E Orthogonal partial least-squares discriminant analysis of redox metabolites (n = 9). F GSH/GSSG level at 2 days after SCI (n = 9, Data are presented as Mean ± SD, and statistical significance was determined by unpaired T-TEST). Values are normalized with the sham group. Data were analyzed on MetaboAnalyst 5.0 (https://www.metaboanalyst.ca/). G Mechanism of GPX4 inactivation. ∗: p < 0.05, ∗∗: p < 0.01, ns: no significance.
Fig. 2
Fig. 2
Spatial expression profile of GPX4 A Spatial expression of GPX4 in the spinal cord section. Representative images of the intact spinal cord: GPX4 in green, NeuN/CC1/Iba-1/GFAP in red, and DAPI in blue. B Coronal section of the intact spinal cord. DH, dorsal horn. VH, ventral horn. C Pearson's R value of different cell types. D Quantification of dorsal horn and ventral horn neuronal GPX4. E GPX4 expression level at 1 d after SCI. GPX4 (green), NeuN (red) and DAPI (blue). F Quantification of neuronal GPX4 in the rostral, lesion epicenter and caudal of the spinal cord. G Quantifications of neuronal GPX4 at the rostal site of SCI. (n = 3, Data are presented as Mean ± SD, and statistical significance was determined by one-way ANOVA with Tukey's post-hoc test). ∗: p < 0.05, ∗∗: p < 0.01, ∗∗∗: p < 0.001, NS: no significance.
Fig. 3
Fig. 3
GPX4 inhibition-induced neuronal ferroptosis is associated with inflammation. A Experimental design of RSL3-induced ferroptosis in neurons. B GPX4 expression in primary neurons. GPX4 (green), β-III-Tubulin (red) and DAPI (blue). C GPX4 expression decreases after RSL3 treatment (GPX4 in green). D Representative western blot images of GPX4 and ACSL4. E Quantification of western blot images (n = 3, Data are presented as Mean ± SD, and statistical significance was determined by unpaired T-TEST). F GSH level of RSL3-induced ferroptosis in neurons (n = 3, Data are presented as Mean ± SD, and statistical significance was determined by unpaired T-TEST). G MDA level of RSL3-induced ferroptosis in neurons (n = 3, Data are presented as Mean ± SD, and statistical significance was determined by unpaired T-TEST). H KEGG of RSL3-induced ferroptosis in neurons. I Quantification of key proteins in the DEGs via PPI analysis. J Quantification of expression levels of Serpinb2, IL-1β, IL-6, CCL2, and CCL5 by RT-PCR (n = 6, Data are presented as Mean ± SD, and statistical significance was determined by unpaired T-TEST). K Experimental design of microglial activation induced by neuronal ferroptosis. L Quantification of TNF-α and Arg-1 after microglial activation by RT-PCR (n = 3, Data are presented as Mean ± SD, and statistical significance was determined by unpaired T-TEST). ∗:p < 0.05, ∗∗: p < 0.01, ∗∗∗: p < 0.001, ∗∗∗∗: p < 0.0001.
Fig. 4
Fig. 4
GPX4 activation regulates ferroptosis. A Schematic diagram of the GPX4 allosteric activator binds to the opposite side of the GPX4 activity site. Pymol was used to illustrate the predicted binding of the GPX4 activator with the GPX4 crystal structure (Protein Data Bank ID 2OBI). B GPX4 activity after adding GPX4 activator. C Experimental design of GPX4 activation. D Representative western blot images of GPX4, ACSL4, and 15-LOX. E Quantification of GPX4, 15-LOX, and ACSL4 protein level at 1 day after SCI (n = 4, Data are presented as Mean ± SD, and statistical significance was determined by one-way ANOVA with Tukey's post-hoc test). F Spinal cord sagittal section of the Sham, SCI, and SC + GPX4 activator treatment group. GPX4 in green, NeuN in red, GFAP in magenta, and DAPI in blue. G Quantification of the neuron number in the epicenter, rostral, and caudal of the lesion spinal cord segment. H Quantifications of neuronal GPX4 of SCI tissue. I 4-HNE expression level at 3 day after SCI. NeuN (green), 4-HNE (red), DAPI (blue). J Quantifications of neuronal 4-HNE. (n = 3, Data are presented as Mean ± SD, and statistical significance was determined by one-way ANOVA with Tukey's post-hoc test). ∗:p < 0.05, ∗∗: p < 0.01, ∗∗∗: p < 0.001, ∗∗∗∗: p < 0.0001, ns: no significance.
Fig. 5
Fig. 5
GPX4 activation regulates neuroinflammation. A Neuronal CCL2 expression level at 3 day after SCI. NeuN (red), CCL2 (green), DAPI (blue). B Quantifications of neuronal CCL2 (n = 3). C TNFα expression level in microglia. Iba1 (red), TNFα (green), DAPI (blue). D Quantifications of Iba-1 and TNFα. (n = 3). E Arg1 expression level in microglia. Iba1 (red), Arg1 (green), DAPI (blue). F Quantifications of Iba-1 and Arg1. (n = 3). G GPX4 activator reduced the secretion of neuronal CCL2 alleviating microglial activation and polarization to pro-inflammatory subtype. Data are expressed as mean ± standard deviation. Statistical significance was determined by one-way ANOVA. ∗: p < 0.05, ∗∗: p < 0.01, ∗∗∗: p < 0.001.
Fig. 6
Fig. 6
GPX4 activation promotes functional recovery after SCI. A Experimental design to detect functional recovery after GPX4 activator administration. B BBB scores at different time points after SCI (n = 5, Data are presented as Mean ± SD, and statistical significance was determined by one-way ANOVA with Tukey's post-hoc test). C Representative images of footprint at 8 weeks after SCI by catwalk test. D Grid-walk test at 8 weeks after SCI (n = 5, Data are presented as Mean ± SD, and statistical significance was determined by one-way ANOVA with Tukey's post-hoc test). E Louisville Swim Scale test at 8 weeks after SCI (n = 5, Data are presented as Mean ± SD, and statistical significance was determined by one-way ANOVA with Tukey's post-hoc test). F Representative images of electrophysiology of MEP at 8 weeks after SCI. G Quantification of the amplitude of MEP (n = 3, Data are presented as Mean ± SD, and statistical significance was determined by one-way ANOVA with Tukey's post-hoc test). H Cartoon of lesion shown by MRI. I Representative T2WI MRI images at 8 weeks after SCI; J Lesion area quantification and K relative T2 hypodensity quantification (n = 5, Data are presented as Mean ± SD, and statistical significance was determined by one-way ANOVA with Tukey's post-hoc test). ∗: p < 0.05, ∗∗: p < 0.01, ∗∗∗: p < 0.001, ∗∗∗∗: p < 0.0001, ns: no significance.
Fig. 7
Fig. 7
Pharmacokinetics and safety assessment of GPX4 activator. A Experimental design of the pharmacokinetics assessment of GPX4 activator. B GPX4 activator concentration in plasma at different time points (n = 5, Data are presented as Mean ± SD). C Pharmacokinetics data of GPX4 activator (n = 5, Data are presented as Mean ± SD). D Experiment design of the safety assessment of GPX4 activator. E Renal function assessment (Urea, CREA, and UA) after 7 days' injection of GPX4 activator (n = 3, Data are presented as Mean ± SD, and statistical significance was determined by unpaired T-TEST). F Hepatic function (ALT, AST, TP, and ALB) assessment detection after 7 days' injection of GPX4 activator (n = 3, Data are presented as Mean ± SD, and statistical significance was determined by unpaired T-TEST). Abbreviation: T1/2: Terminal Half-life, Tmax: time to reach maximum concentration, Cmax: maximum concentration, AUC(0-t): area under the plasma concentration–time curve from time 0 to last time of quantifiable concentration, AUC(0-∞): area under the plasma concentration–time curve from time 0 extrapolated to infinite time, MRT (0-t): mean residence time–time curve from time 0 to last time of quantifiable concentration, MRT (0-∞): mean residence time–time curve from time 0 extrapolated to infinite time, CL: apparent clearance; Vd: apparent volume of distribution; ALT: Alanine aminotransferase; AST: Aspartate aminotransferase; TP: The total protein; ALB: albumin; UA: Uric acid; CREA: Creatinine. ns: no significance.
Fig. 8
Fig. 8
Schematic illustration of the pivotal role of GPX4 in SCI and the neuroprotection of specific GPX4 activation after SCI. A GPX4 expression decreases in neurons at acute and subacute stages following SCI. B GPX4 inhibition by RSL3 induces ferroptosis in primary neurons in vitro and leads to an increase in pro-inflammatory cytokines expression and microgliosis. C A specific small molecule GPX4 activator facilitates neuronal survival, reduces microgliosis, and thus promotes functional recovery after SCI.
figs1
figs1
GPX4 inhibitor RSL3 induces neuronal ferroptosis model in vitro. A IC50 of GPX4 inhibitor RSL3 in neuronal ferroptosis model in vitro. Neurons were treated with different concentrations of RSL3 for 48 hours and cell viability was detected using CCK8 (n=5, Data are presented as Mean ± SD). B Volcano map of the DEGS of RSL3-induced ferroptosis in neurons. C Heatmap of DEG of RSL3-treated and untreated neurons. D GO enrichment analysis was conducted to clarify gene function. E BBB scores for different dosages of GPX4 activator after SCI (n=5, Data are presented as Mean ± SD, and statistical significance was determined by one-way ANOVA with Tukey’s post-hoc test).

Similar articles

Cited by

References

    1. Squair J.W., Gautier M., Mahe L., Soriano J.E., Rowald A., Bichat A., et al. Neuroprosthetic baroreflex controls haemodynamics after spinal cord injury. Nature. 2021;590(7845):308–314. - PubMed
    1. Koffler J., Zhu W., Qu X., Platoshyn O., Dulin J.N., Brock J., et al. Biomimetic 3D-printed scaffolds for spinal cord injury repair. Nat Med. 2019;25(2):263–269. - PMC - PubMed
    1. Ahuja C.S., Wilson J.R., Nori S., Kotter M.R.N., Druschel C., Curt A., et al. Traumatic spinal cord injury. Nat Rev Dis Primers. 2017;3 - PubMed
    1. Jiang B., Sun D., Sun H., Ru X., Liu H., Ge S., et al. Prevalence, incidence, and external causes of traumatic spinal cord injury in China: a Nationally Representative Cross-Sectional Survey. Front Neurol. 2021;12 - PMC - PubMed
    1. Spinal Cord Injury SCI) 2016 facts and figures at a glance. J Spinal Cord Med. 2016;39(4):493–494. - PMC - PubMed

LinkOut - more resources