

Exploring rare earth elements in coalmine overburden: nanoscale insights from FESEM, TEM and XPS analysis
- PMID: 40486175
- PMCID: PMC12143257
- DOI: 10.1039/d5ra02774h
Exploring rare earth elements in coalmine overburden: nanoscale insights from FESEM, TEM and XPS analysis
Abstract
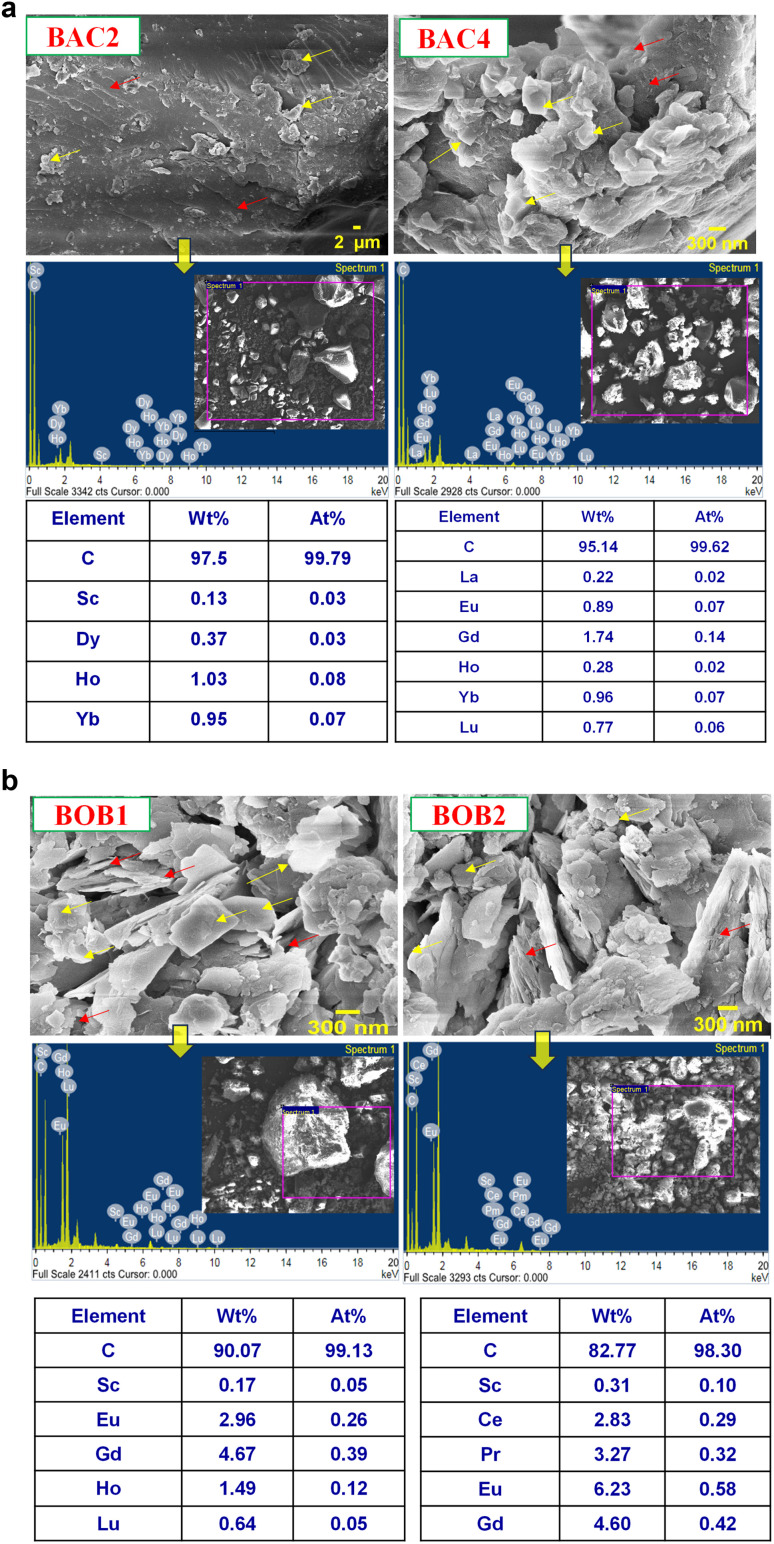
Rare earth elements and yttrium (REY) are critical for various advanced technologies, particularly in electronics, and play a vital role in the economic growth of any country. Coal and its by-products could be potential precursors of these commodities and other natural resources. While coal and coal fly ash have been assessed for their REY content, the coal mine overburden (OB) or waste remains unexplored as a potential source of rare earth elements. The coal and coalmine OB samples of the Makum coalfield from the Northeastern region (NER) of India are examined and found to be promising sources of REY. This study presents the existence, distribution, and depositional conditions of REY in the coal and coalmine OB using various advanced analytical techniques, such as nanoscale morphology, Field Emission Scanning Electron Microscopy (FE-SEM), and High-Resolution Transmission Electron Microscopy (HR-TEM) to provide light on the geochemical behaviour and potential commercial viability of REY. The average value of REY in the study area is 167.66 mg kg-1 on a whole sample basis, in which the mean light (LREY) to heavy (HREY) ratio is 37.67. The average values of the europium anomaly (δEu), cerium anomaly (δCe), and Gadolinium anomaly (δGd) are 3.20, 0.71, and 5.30, respectively. The coal-forming conditions are characterized by slightly oxidizing and highly reducing environments, dominated by M-type enrichment, which are favourable for the weathering process. These conditions, marked by the absence of anaerobic microbial activity, facilitated the preservation of organic matter. Thus, the OB and coal deposits in this region present an opportunity for further exploration and assessment regarding the potential future recovery of REY.
This journal is © The Royal Society of Chemistry.
Conflict of interest statement
There are no conflicts to declare.
Figures


Similar articles
-
Major and Rare Earth Element Characteristics of Late Paleozoic Coal in the Southeastern Qinshui Basin: Implications for Depositional Environments and Provenance.ACS Omega. 2022 Aug 22;7(35):30856-30878. doi: 10.1021/acsomega.2c02596. eCollection 2022 Sep 6. ACS Omega. 2022. PMID: 36092626 Free PMC article.
-
Geochemistry and mineralogy of coal mine overburden (waste): A study towards their environmental implications.Chemosphere. 2021 Jul;274:129736. doi: 10.1016/j.chemosphere.2021.129736. Epub 2021 Jan 25. Chemosphere. 2021. PMID: 33540311
-
Geochemical Characteristics and Indicative Significance of Rare Earth Elements in the Late Permian Coal of Tucheng Mine, Guizhou Province.ACS Omega. 2025 Aug 12;10(33):38056-38063. doi: 10.1021/acsomega.5c05303. eCollection 2025 Aug 26. ACS Omega. 2025. PMID: 40893295 Free PMC article.
-
Sources, distribution and effects of rare earth elements in the marine environment: Current knowledge and research gaps.Environ Pollut. 2021 Dec 15;291:118230. doi: 10.1016/j.envpol.2021.118230. Epub 2021 Sep 28. Environ Pollut. 2021. PMID: 34597732 Review.
-
The Minderoo-Monaco Commission on Plastics and Human Health.Ann Glob Health. 2023 Mar 21;89(1):23. doi: 10.5334/aogh.4056. eCollection 2023. Ann Glob Health. 2023. PMID: 36969097 Free PMC article. Review.
References
-
- Bhuyan N. Islam N. Saikia M. Hower J. C. Saikia B. K. Geochemical and mineralogical evaluations of coal, shale, and mine waste overburden from Makum coalfield of the Northeast India. Int. J. Coal Sci. Technol. 2023;10(1):44. doi: 10.1007/s40789-023-00602-8. - DOI
-
- Dai S. Hower J. C. Finkelman R. B. et al., Organic associations of non-mineral elements in coal: A review. Int. J. Coal Geol. 2020;218:103347. doi: 10.1016/J.COAL.2019.103347. - DOI
-
- Saikia B. K. Wang P. Saikia A. et al., Mineralogical and elemental analysis of some high-sulfur Indian Paleogene coals: A statistical approach. Energy Fuels. 2015;29(3):1407–1420. doi: 10.1021/EF502511T/ASSET/IMAGES/LARGE/EF-2014-02511T_0006.JPEG. - DOI
-
- Saikia B. K. Saikia A. Choudhury R. et al., Elemental geochemistry and mineralogy of coals and associated coal mine overburden from Makum coalfield (Northeast India) Environ. Earth Sci. 2016;75(8):1–21. doi: 10.1007/S12665-016-5484-X/METRICS. - DOI
-
- U. S. Geological Survey, Mineral Commodity Summaries 2021, 2021
LinkOut - more resources
Full Text Sources
Research Materials
Miscellaneous