. 2025 May 10;10(1):bpaf037.
doi: 10.1093/biomethods/bpaf037. eCollection 2025.

Donor-specific digital twin for living donor liver transplant recovery

Affiliations

Donor-specific digital twin for living donor liver transplant recovery

Suvankar Halder et al. Biol Methods Protoc. .

Abstract

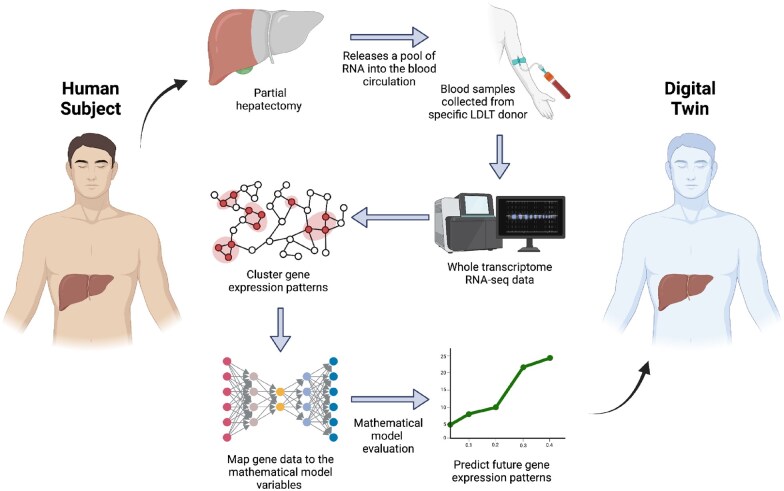
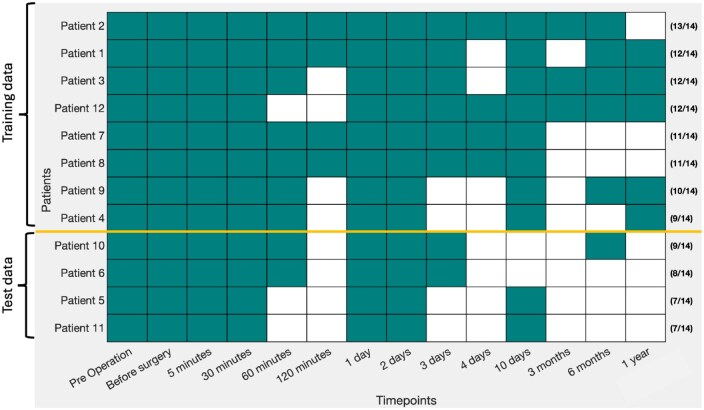
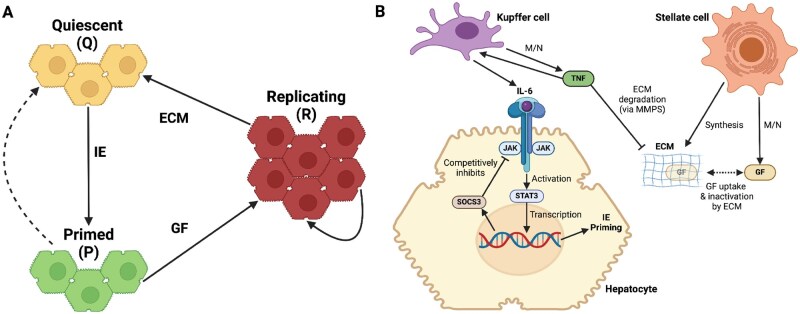
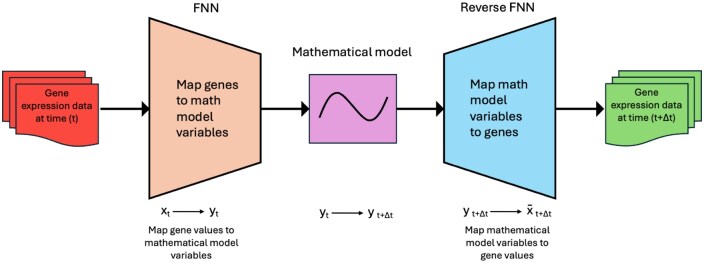
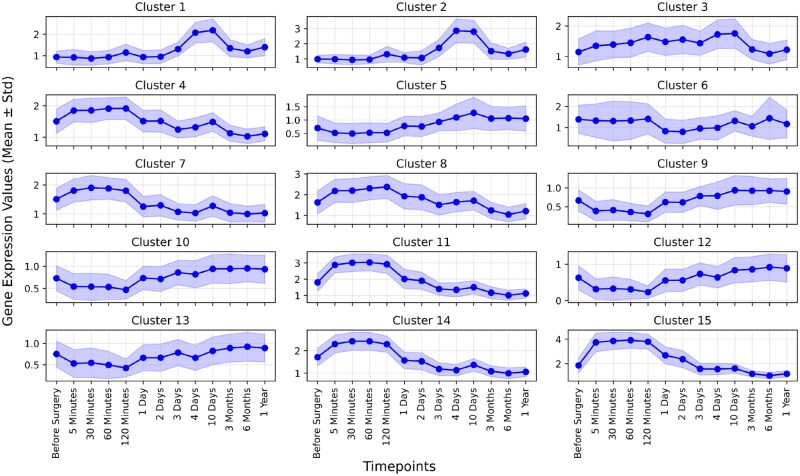
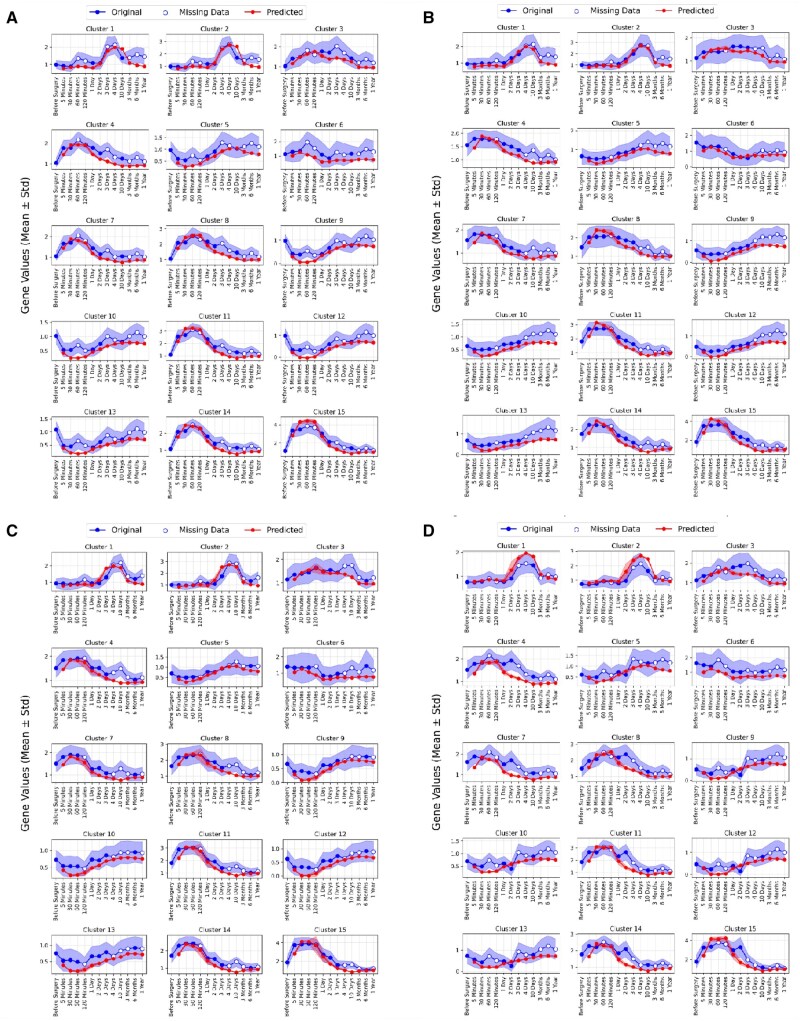
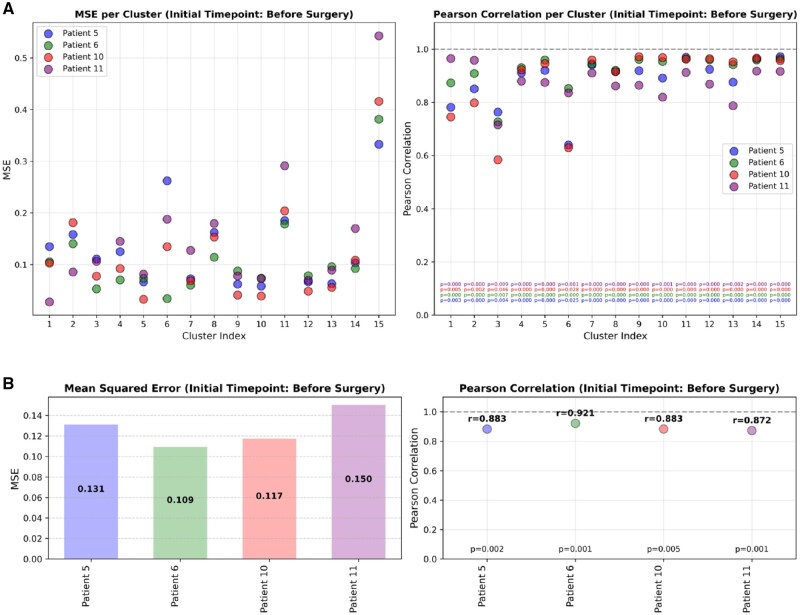
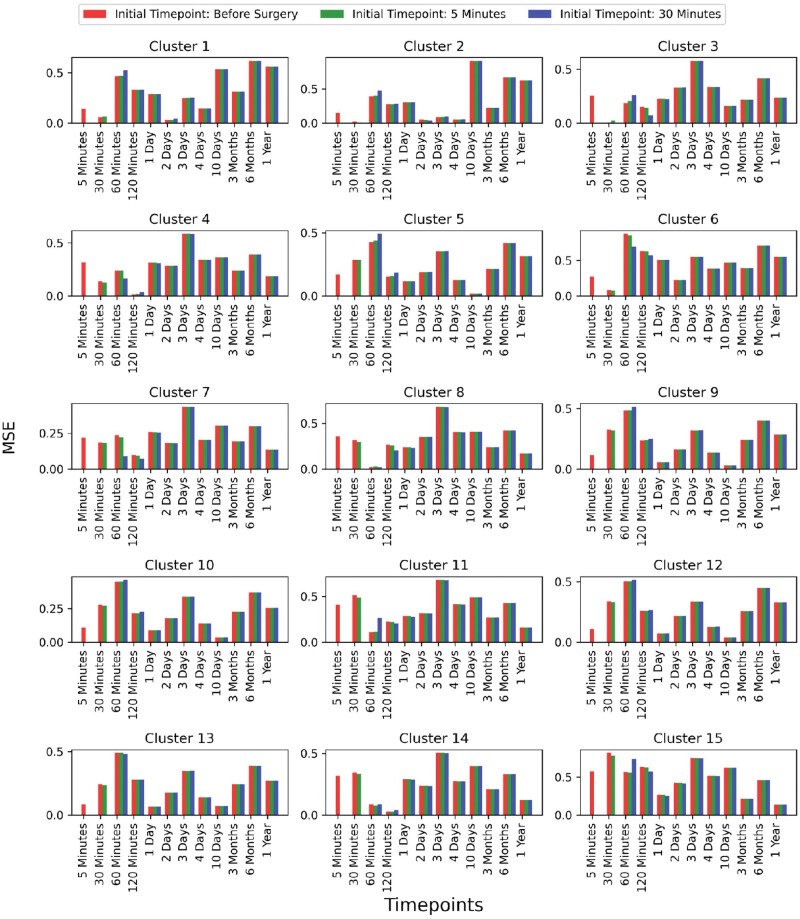
The remarkable capacity of the liver to regenerate its lost mass after resection makes living donor liver transplantation a successful treatment option. However, donor heterogeneity significantly influences recovery trajectories, highlighting the need for individualized monitoring. With the rising incidence of liver diseases, safer transplant procedures and improved donor care are urgently needed. Current clinical markers provide only limited snapshots of recovery, making it challenging to predict long-term outcomes. Following partial hepatectomy, precise liver mass recovery requires tightly regulated hepatocyte proliferation. We identified distinct gene expression patterns associated with liver regeneration by analyzing blood-derived gene expression measurements from twelve donors followed over a year. Using a deep learning-based framework, we integrated these patterns with a mathematical model of hepatocyte transitions to develop a personalized, progressive mechanistic digital twin-a virtual liver model that predicts donor-specific recovery trajectories. Central to our approach is a mechanistically identifiable latent space, defined by variables derived from a physiologically grounded differential equation model of liver regeneration, which enables biologically interpretable, bidirectional mapping between gene expression data and model dynamics. This approach integrates clinical genomics and computational modeling to enhance post-surgical care, ensuring safer transplants and improved donor recovery.

Keywords: deep learning; digital twin; liver regeneration; living donor liver transplant (LDLT); mathematical modeling; partial hepatectomy.


Conflict of interest statement

The authors declare no competing interests.

Figures

Figure 1.
Figure 1.
Framework of the digital twin. The figure depicts the general framework of the digital twin for liver regeneration. Blood samples are collected from a specific LDLT donor after partial hepatectomy, followed by whole transcriptomic analysis. Identified genes are clustered into functional groups and mapped onto a mechanistic mathematical model describing liver regeneration. The model predicts dynamic variables at future time points, which are then used to forecast future gene expression patterns.
Figure 2.
Figure 2.
Data structure. The dataset consists of samples obtained from 12 healthy LDLT donors, collected at 14 distinct time points over the course of 1 year following partial hepatectomy. Filled color boxes indicate the presence of data, while blank spaces represent missing data. Donors are arranged in descending order based on the number of available time points. The number of available data points out of the 14 total time points is indicated on the right side for each donor. The top two-thirds of the dataset is used for training, while the remaining one-third serves as the testing dataset. The lower portion of the dataset was chosen for testing because these samples lack gene expression values in the later stages, providing an opportunity for predictive modeling.
Figure 3.
Figure 3.
Schematic overview of liver regeneration. (A) The cell cycle dynamics during liver regeneration, highlighting changes in cell numbers. (B) The biochemical pathways involved in liver regeneration, illustrating key molecular interactions driving hepatocyte proliferation and tissue remodeling.
Figure 4.
Figure 4.
Schematic representation of the digital twin framework. The process involves a two-step mapping approach combined with mathematical model simulations. First, gene expression data are mapped onto key physiological parameters of the mathematical model. The model then simulates liver regeneration dynamics over future time points. Finally, the simulated mathematical values are reverse-mapped to reconstruct gene expression values, enabling the prediction of molecular responses in LDLT donors over time.
Figure 5.
Figure 5.
Temporal gene modules. A visual representation of the temporal gene expression patterns across 15 distinct clusters, which were subsequently grouped into three modules, during the liver resection and regeneration process. The bold lines represent the mean log2 fold change relative to preoperative values, and the shaded regions indicate the standard deviations.
Figure 6.
Figure 6.
Comparison of original and predicted gene expression profiles. The plot illustrates the temporal gene expression patterns for individual test donors—donor 5 (A), donor 6 (B), donor 10 (C), and donor 11 (D). Bold lines represent the mean log2 fold change relative to preoperative values, with shaded regions indicating standard deviations. Red lines denote the predicted values, while blue lines represent the original (true) gene expression values. Open circles indicate time points where data are missing in the original dataset.
Figure 7.
Figure 7.
Donor-specific prediction accuracy. Comparison of prediction accuracy across individual test donors for the initial time point (before surgery). Panel A shows the MSE and Pearson correlation coefficients between the true and predicted gene expression profiles for each cluster; the corresponding P-values are color-coded in the right figure. Panel B displays the averaged MSE and averaged Pearson correlation across clusters, with the corresponding P-values also indicated.
Figure 8.
Figure 8.
Comparison of prediction accuracy with different initial time points. The figure depicts error bars representing the mean squared errors between the true values and the predicted values for each time point for donor 5. The red, green, and blue bars correspond to the initial time-points chosen as before surgery, 5 min post-surgery, and 30 min post-surgery, respectively. This comparison is shown for all 15 clusters.
Figure 9.
Figure 9.
Global sensitivity analysis. The y-axis represents the mathematical model parameters, and the x-axis represents time points. The color bar indicates the PRCC values, which measure the sensitivity of each parameter. Asterisks denote statistically significant P-values: * for P < 0.05, ** for P < .01, and *** for P < .001.
Figure 10.
Figure 10.
Effect of gene perturbation on liver volume recovery. For the test donor 5, the expression levels of individual gene clusters were systematically perturbed from −100% to +100% at three early time points: Panel A—Before surgery, Panel B—5 min post-surgery, and Panel C—30 min post-surgery. The corresponding liver volume was predicted at a representative late time point (3 months). The x-axis indicates the percentage change in gene expression, and the y-axis shows the predicted liver volume fraction. Each colored line with dots represents a different gene cluster, illustrating how specific clusters influence liver volume recovery.

Update of

Similar articles

References

    1. Michalopoulos GK, Bhushan B. Liver regeneration: biological and pathological mechanisms and implications. Nat Rev Gastroenterol Hepatol 2021;18:40–55. - PubMed
    1. Forbes SJ, Newsome PN. Liver regeneration—mechanisms and models to clinical application. Nat Rev Gastroenterol Hepatol 2016;13:473–85. - PubMed
    1. Abu Rmilah A, Zhou W, Nelson E et al. Understanding the marvels behind liver regeneration. Wiley Interdiscip Rev Dev Biol 2019;8:e340. - PMC - PubMed
    1. Ma X, Huang T, Chen X et al. Molecular mechanisms in liver repair and regeneration: from physiology to therapeutics. Signal Transduct Target Ther 2025;10:63. - PMC - PubMed
    1. Chen F, Jimenez RJ, Sharma K et al. Broad distribution of hepatocyte proliferation in liver homeostasis and regeneration. Cell Stem Cell 2020;26:27–33.e4. - PMC - PubMed

LinkOut - more resources